Energy Transition
June 22, 2026
Transport decarbonization is shaped by electrification, affordability, grid readiness
By Beatriz Minamy and Tomás Pintado
Highlights
- The constraint has shifted from technology to system execution: Transport decarbonization is no longer limited by EV technology, but by the misalignment between emissions targets, vehicle affordability, and grid capacity. The core challenge is scaling real-world adoption, not improving vehicles themselves.
- Electrification will be gradual and economically driven: The transition to low-emission transport will unfold over multiple decades, constrained by long vehicle lifecycles and mixed OEM portfolios. Adoption is driven primarily by cost, total cost of ownership, and charging convenience—not environmental considerations.
- Decarbonization outcomes depend on grid readiness and coordination: As EV adoption grows, emissions reduction increasingly depends on power system factors such as grid capacity, carbon intensity, and charging infrastructure. Success requires coordinated deployment across vehicles, energy systems, and infrastructure rather than isolated progress.
Market dynamics: Forces shaping electrification
While electric vehicle (EV) adoption continues to expand, fleet‑level change is slow. Long vehicle lifetimes — typically more than a decade in mature markets — mean that new sales translate only gradually into changes in the on‑road vehicle stock, anchoring electrification to a multi‑cycle transition rather than a rapid shift.
At the same time, automotive OEM portfolios remain structurally weighted toward mixed powertrains. Most automotive manufacturers are positioned in traditional or transition archetypes, rather than fully EV-led strategies. Based on analysis of data from S&P Global Sustainable1’s Corporate Sustainability Assessment (CSA), OEMs are classified based on the share of new-energy vehicles (NEVs) — including battery-electric vehicles (BEVs), fuel-cell electric vehicles, hybrid electric vehicles and plug-in hybrid electric vehicles — in their sales portfolios (see Figure 1).
Figure 1: Transition‑stage companies already represent 41% of total vehicle sales
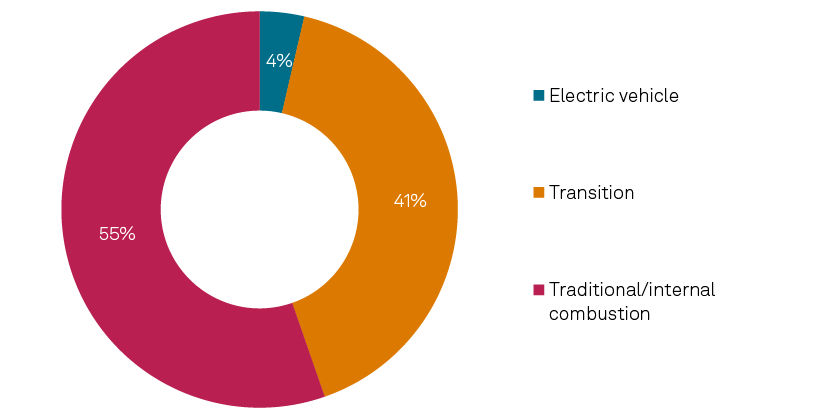
EV-led companies derive more than 80% of sales from NEVs, transition companies exceed 25%, and traditional/ICE companies remain below 25%. The analysis shows that more than half of assessed OEMs — representing roughly 90% of global industry revenue — continue to generate less than 25% of sales from EVs, indicating portfolios optimized for incremental rather than disruptive change. While passenger vehicle manufacturers dominate this data, their strategies have an outsized impact, shaping the technology, supply chains and cost-reduction curves for the entire on-road transport ecosystem.
The prevalence of traditional and transition portfolios limits scale effects, slows cost deflation and constrains EV availability across vehicle segments, particularly outside early-adopter markets. As a result, supply-side strategies not only respond to demand conditions but actively shape them, reinforcing a gradual, system-level transition rather than enabling a rapid inflection in fleet electrification.
Regulation plays a key role in shaping coordination and the pace of electrification. In China, state‑directed industrial policy helps align automakers, battery suppliers and grid operators, accelerating deployment. In contrast, regulatory divergence across Western markets slows progress: Europe continues to apply emissions standards, even if softened, maintaining pressure on OEMs to expand electric and hybrid offerings, while the US is rolling back federal greenhouse gas (GHG) rules, reducing near‑term urgency.
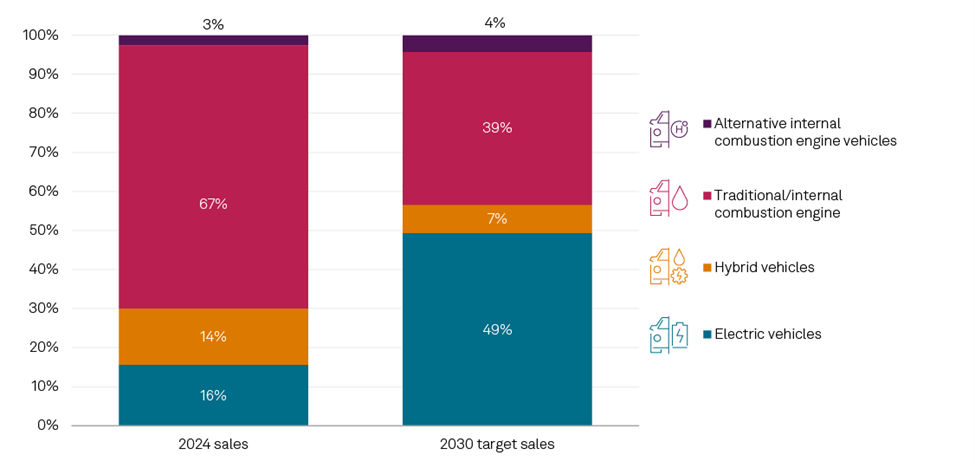
As shown in Figure 2, auto OEMs project a significant shift toward alternative powertrains by 2030, with EVs expected to account for nearly half of new sales. However, the continued reliance on ICE drivetrains highlights the transitional nature of their strategies.
Figure 2: Shift toward alternative powertrains by 2030
Passenger vehicles: Ownership, motivations and barriers
For the mass-market consumer, EV adoption is driven by practical calculation, not environmental motivation. The key concerns are budget, charging logistics and trust. This is reflected in our Voice of the Connected User Landscape (VoCUL): Connected Electric & Hybrid Vehicles 2025 survey, which shows that hybrids and EVs still represent a minority of vehicles on US roads.
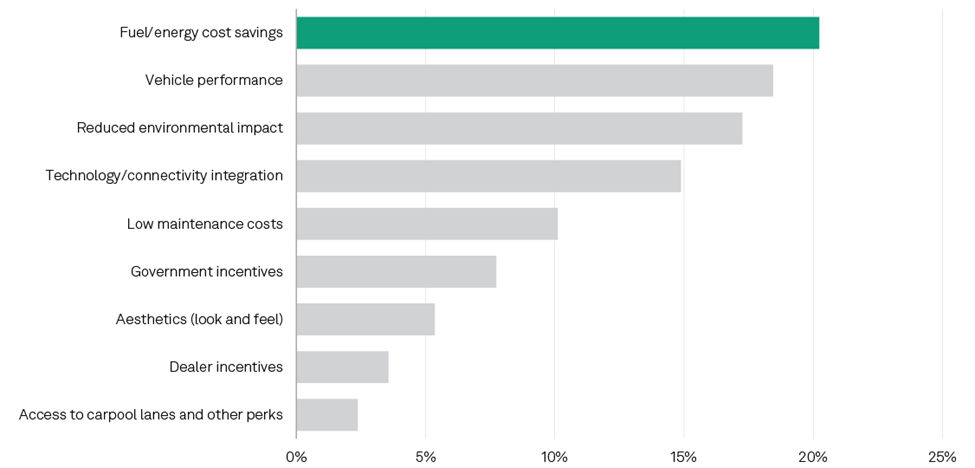
While purchase intent points to a gradual shift toward electrified options, this trend is shaped mainly by cost and usability factors. Price (16%), performance (15%), and fuel or energy savings (11%) rank as the most important purchase criteria, while environmental impact ranks far lower at 2%. Even among current hybrid and EV owners, motivations remain largely practical: fuel and energy savings and performance outweigh environmental considerations (see Figure 3). High up-front costs remain the leading barrier, followed by charging infrastructure availability, range limitations and charging time.
Figure 3: Reasons for electric vehicle purchase
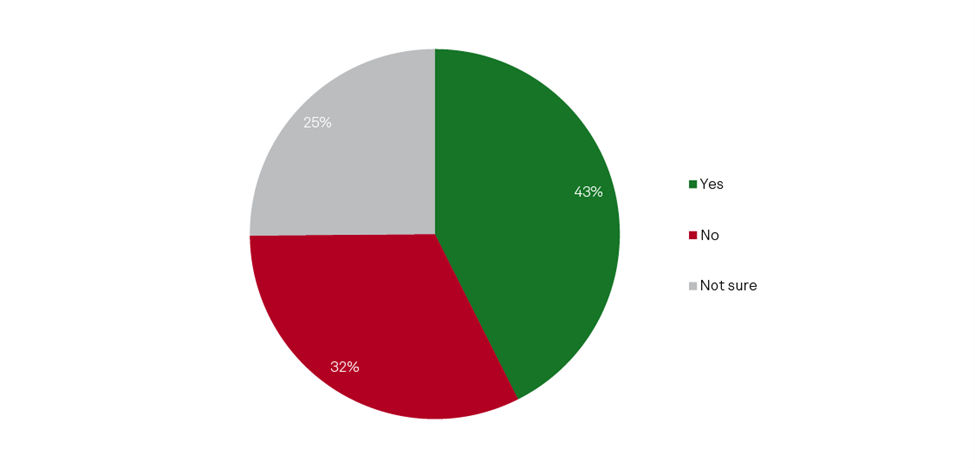
Meanwhile, fewer than half of respondents (43%) believe EVs significantly reduce environmental impact compared with ICE vehicles, while a third do not believe EVs are better for the environment, and a quarter are unsure (see Figure 4). This reflects confusion between emissions generated during vehicle manufacturing, including the battery and other components, and emissions produced over the vehicle’s lifetime during operation. Because manufacturing emissions occur up-front while use-phase emissions accumulate gradually, the overall environmental impact of EVs is not always easy for consumers to evaluate.
Figure 4: Consumer views on EV environmental benefit vs. ICE
As a result, consumer EV adoption is approached mainly as a practical decision, with cost, convenience and reliability weighing more heavily than environmental considerations. While mass-market consumer decisions are shaped by budget and convenience, the commercial sector operates under different economic and operational pressures.
Commercial transportation: Economics, operations and charging challenges
Passenger vehicles currently lead electric adoption in penetration and scale, while commercial electrification is advancing through focused, high‑impact deployments aligned with duty‑cycle economics and infrastructure readiness. Commercial transportation is expected to expand steadily over the next decade. Reflecting this momentum, 451 Research’s Supply Chain Digital Transformation Survey 2026 finds that nearly half of transportation respondents plan to deploy some form of fleet electrification — including hybrid and battery‑electric vehicles — across more than 50% of their fleets by 2030.
Commercial fleet electrification is driven by operational feasibility and cost performance, with operators prioritizing predictable uptime, route reliability, payload capacity and total cost of ownership. Electrification is most viable in stable, repeatable use cases such as last‑mile delivery, return‑to‑base fleets and fixed regional routes where charging can be centralized at depots under managed energy tariffs. Applications with variable routes, high payload requirements or long‑haul distances face greater complexity due to higher charging power needs, dwell‑time constraints and reliance on corridor infrastructure.
EV charging requirements further differentiate commercial electrification from the passenger vehicle market, particularly where operations depend on high‑voltage DC fast charging to support tight turnaround times or extended duty cycles. The survey results indicate that fleet charging is more time‑critical than residential charging and frequently requires higher‑power connections and grid upgrades, including mid‑voltage service. As a result, infrastructure delivery — rather than vehicle procurement alone — often determines deployment timelines.
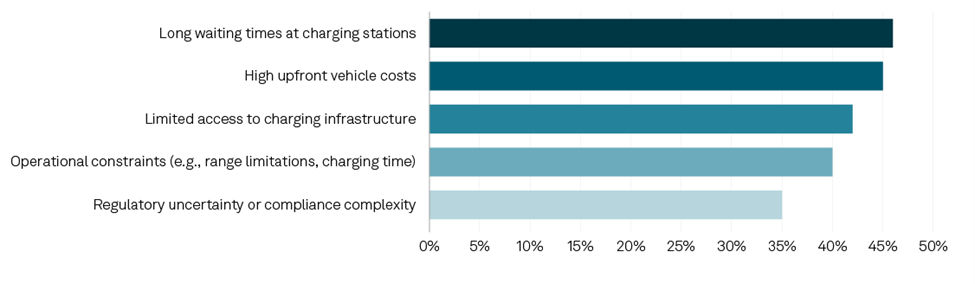
Accordingly, DC fast‑charging access, site readiness and charging availability emerge as central adoption factors. Charging wait times, limited access to infrastructure and charging‑related operational constraints rank among the most commonly cited challenges for fleet operators (see Figure 5). Successful commercial EV deployment increasingly depends on coordinated delivery of vehicles, high‑voltage DC charging infrastructure and grid capacity.
Figure 5: Top-cited fleet electrification challenges
Emissions, efficiency and the role of powertrains
To understand the life-cycle impact of electrification, it is essential to analyze the emissions profiles of major automotive OEMs. While the most comprehensive data reflects the passenger car market due to reporting availability, it establishes a key baseline for the importance of use-phase emissions that is relevant to all vehicle segments.
In the automotive sector, Scope 3 emissions include indirect emissions generated across the value chain beyond an automaker’s own operations. These include upstream emissions from materials and component production, as well as downstream emissions produced during vehicle use. As vehicles consume fuel or electricity over many years, use‑phase emissions account for the majority of automotive emissions, driving Scope 3 to represent approximately 98% of total life-cycle emissions, far exceeding emissions from manufacturing (Scope 1) and purchased energy (Scope 2).
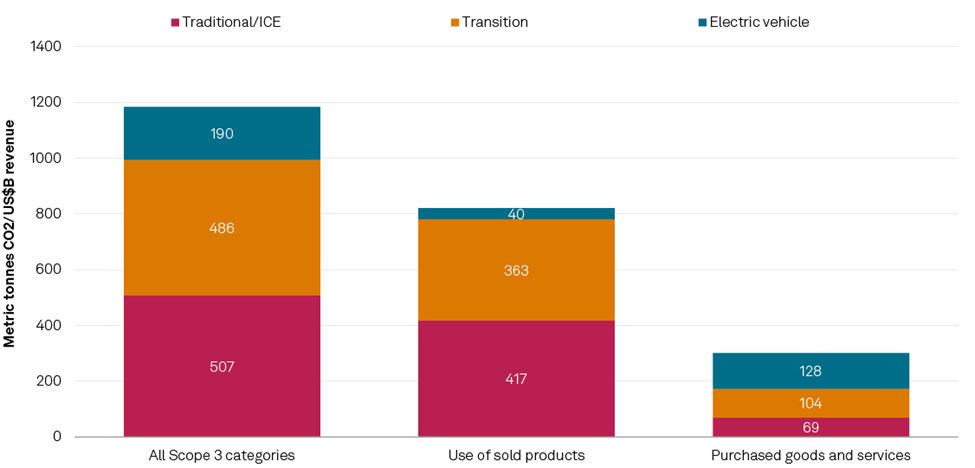
S&P Global Sustainable1 data shows that most automotive Scope 3 emissions are concentrated among OEMs with portfolios dominated by internal combustion engine (ICE) vehicles, highlighting the relationship between drivetrain mix and use‑phase emissions profiles. OEMs with a higher share of EVs show comparatively lower use‑phase emissions, highlighting the influence of portfolio composition on overall emissions levels (see Figure 6).
BEVs have higher production-stage emissions than ICE vehicles, largely due to battery systems, with significant contributions from raw materials extraction and refining as well as battery manufacturing processes. Over their operating lifetime, they deliver lower Scope 3 emissions, driven by higher energy efficiency and the absence of tailpipe emissions. Over time, these lower use-phase emissions can offset higher up-front production impacts, particularly as electricity generation becomes cleaner. Because operating emissions are linked to electricity consumption rather than fuel combustion, grid carbon intensity and charging efficiency are key determinants of life-cycle emissions.
Hybrid powertrain vehicles typically fall between ICE vehicles and EVs in emissions performance. While hybrids can lower emissions relative to conventional ICE vehicles, outcomes vary depending on factors such as vehicle mass, driving patterns and charging behavior. Plugin hybrids that are not consistently charged may deliver more limited emissions benefits. Emissions data suggests that OEMs with mixed or transitional powertrain portfolios often maintain Scope 3 emissions profiles closer to those of ICE‑focused manufacturers than to EV‑oriented peers.
Regulatory pressure across Europe, China and the US has delivered measurable efficiency improvements in recent years, lowering per‑vehicle emissions intensity. However, the pace of improvement is slow, suggesting that efficiency gains alone are insufficient to offset the growth of vehicle fleets and continued reliance on combustion technologies. Efficiency improvements alone cannot deliver sustained transport decarbonization at scale.
While hybridization can reduce near‑term transition risk, it does not address long‑term structural emissions. Based on current deployment trends and available data, electrification offers the most scalable pathway to Scope 3 emissions reduction across the segments examined in this report. As a result, transport decarbonization increasingly becomes a power‑system challenge — driven by grid capacity, carbon intensity, and the timing and coordination of charging infrastructure investment.
For passenger vehicles, emissions outcomes are closely tied to perceptions of life-cycle impact, home and public charging access, resale value and trust in grid cleanliness — making transparent communication about grid mix and charging emissions critical. In commercial medium‑and heavy‑duty transportation, higher vehicle utilization amplifies the emissions benefits of electrification. Still, outcomes hinge on operational fit, depot and corridor charging availability and access to reliable, competitively priced electricity. In both cases, emissions performance is increasingly determined not just by vehicle technology, but by the broader energy system in which those vehicles operate.
Figure 6: Automotive Scope 3 emissions by drivetrain type and category
Comparison of the three largest Scope 3 emission categories across drivetrain‑transition groups
Grid dependence of transport decarbonization
Transport electrification ties decarbonization outcomes directly to power‑system performance, as rising electricity demand elevates the importance of grid capacity, carbon intensity and local reliability in determining real‑world emissions reductions. According to S&P Global Energy, transport electricity demand is projected to reach approximately 933 TWh in Europe and nearly 900 TWh in North America by 2050, reflecting combined electrification across passenger and on‑road commercial transportation, and placing significant pressure on transmission and distribution networks.
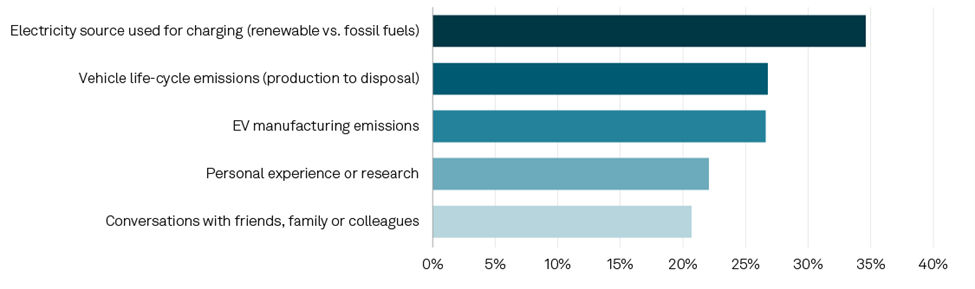
For passenger vehicles, electrification is primarily constrained by the low‑voltage residential and public distribution grid, where local transformer capacity, home‑charging access and neighborhood‑level limitations shape adoption. VoCUL data underscores the importance of transparency to consumer trust, with 63% of respondents expecting charging stations to disclose whether electricity is renewable or fossil‑fuel-based (see Figure 7).
For on‑road commercial transportation, particularly medium‑and heavy‑duty vehicles, electrification increasingly depends on access to the medium‑voltage grid, including depot substations and high‑power corridor charging. In many regions, grid upgrades and connection approvals are not keeping pace with fleet deployment, making time‑to‑power, permitting timelines and utility coordination decisive. Commercial transport decarbonization has become fundamentally a power‑system-integration challenge, rather than a vehicle‑availability problem.
Figure 7: Top factors influencing consumer opinion about the environmental impact of EVs
Comparison of the three largest Scope 3 emission categories across drivetrain‑transition groups
Strategic implications
As electrification moves from early adoption to scale, decarbonization outcomes will increasingly depend on aligned decisions across the value chain. In this context, data interoperability among vehicles, chargers, utilities and platforms will play an increasing role in translating electrification into system‑level emissions reductions.
For automakers
To bridge the gap between long-term EV goals and current market realities, OEMs must focus on building consumer trust and enabling an affordable transition.
- Prioritizing affordability: Developing entry-level EVs with simplified trims and reduced supply chain costs can help to reach mass-market consumers.
- Leveraging hybrids as a transitional bridge: In markets with high EV costs or underdeveloped grids, hybrid models can help reduce near-term transition risks and deliver incremental emissions reductions. However, their impact remains limited, and meaningful Scope 3 decarbonization ultimately depends on full electrification aligned with grid decarbonization and charging infrastructure.
- Strengthening supply chain credibility: Increased disclosures about battery materials sourcing, recycling pathways and life-cycle emissions can serve the dual purpose of building trust and ensuring regulatory compliance.
- Reframing sustainability: Effective vehicle marketing will emphasize total cost of ownership, efficiency and operating savings, rather than environmental signaling alone.
For fleet owners
- Fleet operators are positioned as outsized drivers of transport decarbonization due to scale, centralized operations and predictable duty cycles.
- Operational electrification at scale: Well-defined duty cycles make fleets natural adopters of battery electric vehicles, supported by depot charging, energy management systems and predictable load profiles.
- Energy-aware operations: Increasingly, fleet competitiveness will depend on the ability to integrate EVs with on-site distributed energy resources (DERs), battery energy storage systems (BESS) and managed charging to control energy costs and reduce exposure to grid constraints.
For utilities and grid operators
EV charging must be treated as a structural demand driver, not a marginal load.
- Planning for integrated loads: Grid reinforcement and connection planning must align with EV adoption, depot charging and fleet electrification pipelines.
- Enabling flexibility through interoperability: Clear standards, transparent market signals and interoperability between EVs, chargers, DERs and grid platforms will be essential to unlock managed charging, demand response and future flexibility services.
- Leveraging DERs and BESS: Behind‑the‑meter storage and distributed energy resources can help mitigate peak loads, defer grid upgrades and support system resilience as EV penetration grows.
For the charging ecosystem
To sustain adoption, charging providers must shift from network expansion alone to performance, integration and transparency.
- Focusing on reliability and access: Scaled deployment of reliable DC fast charging — particularly in corridors, depots and multi‑unit residential settings — remains critical.
- Designing for interoperability: Chargers, software platforms and energy systems must support open standards, seamless roaming, and integration with grid and energy management systems.
- Making transparency a feature: Real‑time disclosure of pricing, electricity sourcing and carbon intensity at the point of charge will be increasingly important for user trust and regulatory alignment.
For policymakers
Ambitious emissions targets must be matched by affordability and infrastructure realism.
- Enabling demand‑side adoption: Policies should prioritize cost relief, charging access and transparency mechanisms, rather than mandates alone.
- Supporting system integration: Regulatory frameworks that accelerate grid upgrades, DER deployment, interoperable charging standards and storage integration will increasingly define policy effectiveness.
Conclusions
Electrification will increasingly reward organizations that treat EVs as part of an integrated mobility and energy system. As the transition scales, fragmented vehicle, infrastructure and grid strategies risk slowing adoption and weakening economic and decarbonization outcomes. In this next phase, coordination will determine the pace, credibility and durability of electrification. Failure to coordinate puts the hundreds of billions of dollars already invested directly at risk.
Products & Offerings
Segment