


Jun 18, 2024
Contrasting Upstream Emissions in Northwest Australia Offshore
By Chris Kennett and Try Abednego
The area offshore northwest of Australia, spanning from the North Carnarvon Basin to the Bonaparte Basin, is the country's most significant petroleum producing area. The commercialization of gas in the region, through the development of liquefied natural gas (LNG) projects, has played a significant role in establishing Australia as a prominent global producer of LNG. This achievement started with the Northwest Shelf LNG asset, and has been realized over four decades, during which time the LNG facilities, and other oil and gas field developments have been sanctioned. Recent hydrocarbon development, however, has shifted to fields with high CO2 reservoir content, resulting in significantly higher emissions than in the past. Since operators are also aiming for carbon neutrality and complying with Australia's safeguard mechanism policy while continuing to develop high CO2 fields, carbon capture and storage (CCS) technology has been implemented in the region to reduce emissions, and a number of ongoing or planned projects are anticipated.
To gain insight into the greenhouse gas (GHG) intensity of offshore Northwest Australia oil and gas production, the Scope 1 emissions profiles of all major producing assets in 2022 were analyzed using data from S&P Global Energy Vantage. For this study, the emissions from upstream and LNG facilities were evaluated separately. The production number for each asset was calculated based on the product energy content, which was approximated from the hydrocarbon composition or liquid density. The estimates of GHG emissions include carbon dioxide, methane, and nitrous oxide (CO2, CH4, N2O), and their sources, which consist of fuel gas and diesel combustion, flaring, fugitive emissions, and venting. The emissions intensity of each asset was calculated by dividing the absolute emissions by the asset's product energy content. Methane and nitrous oxide were converted to CO2 equivalent (CO2e) using global warming potentials consistent with the UN Intergovernmental Panel on Climate Change's Fourth Assessment Report (AR4).
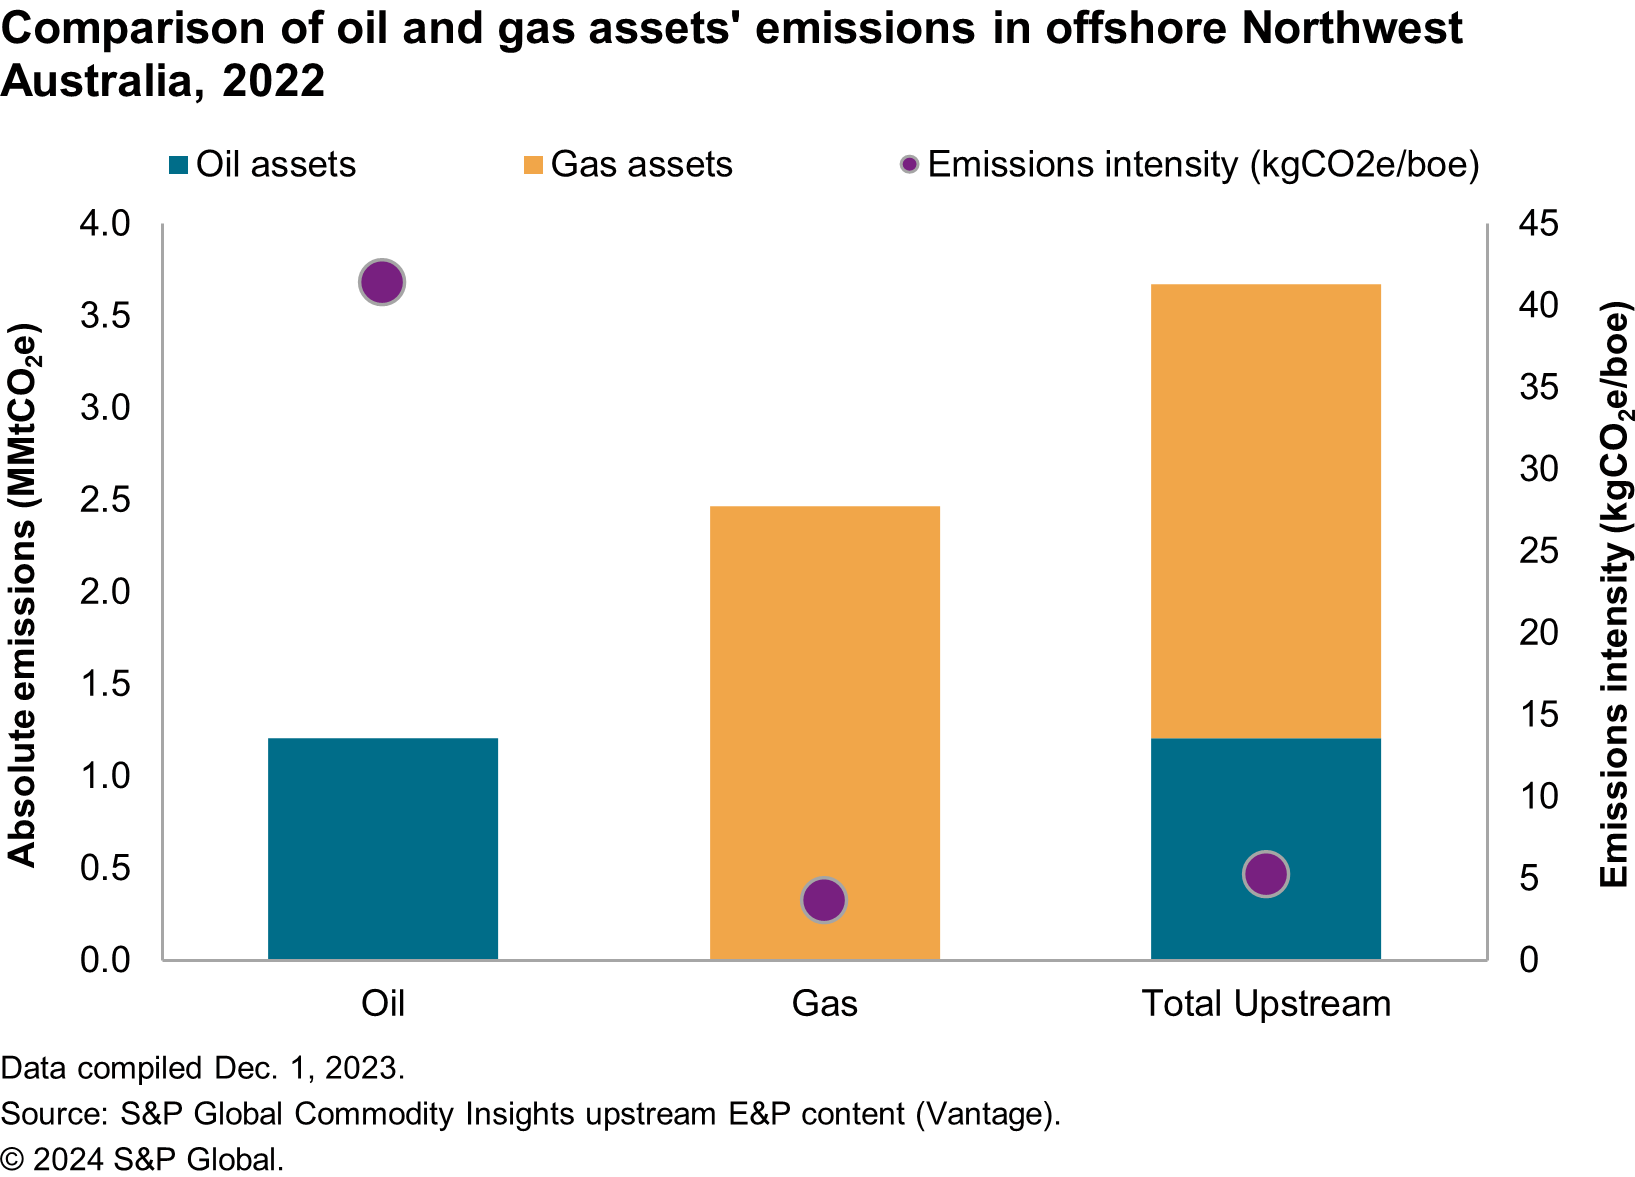
Our study found that the total absolute emissions of offshore Northwest Australia upstream production in 2022 was approximately 3.7 million metric tons of CO2 equivalent (MMtCO2e), resulting in a production weighted average GHG emissions intensity of 5 kilograms of CO2 equivalent per barrel of oil equivalent (kgCO2e/boe) or equivalent to 0.9 grams of CO2 equivalent per megajoule (gCO2e/MJ) on a lower heating value (LHV) basis. In comparison to other regions examined by Energy, the emissions intensity of Northwest Australia was significantly lower than the production weighted average emissions intensity of 7 kgCO2e/boe for the Gulf of Mexico (GOM) and 11 kgCO2e/boe for North Sea production in the year 2022.
Furthermore, when the emissions intensity of oil and gas assets of Northwest Australia were calculated separately, the oil assets had a significantly higher emissions intensity of 41 kgCO2e/boe (7.1 gCO2e/MJ-LHV) compared with the gas assets, which had an emissions intensity of 4 kgCO2e/boe (0.6 gCO2e/MJ-LHV). One factor that contributed to the difference in emissions intensity between Northwest Australia and other regions is the varying proportion of oil and gas assets' production contribution to the overall production. In contrast to the Gulf of Mexico and the North Sea, gas assets were the predominant source of production in offshore Northwest Australia, accounting for 96% of the region's overall output and significantly impacting the region's overall performance. This is in contrast to the Gulf of Mexico and the North Sea, where oil assets account for 96% and 51% of production, respectively, making it challenging to compare emissions intensity across regions with different production characteristics.
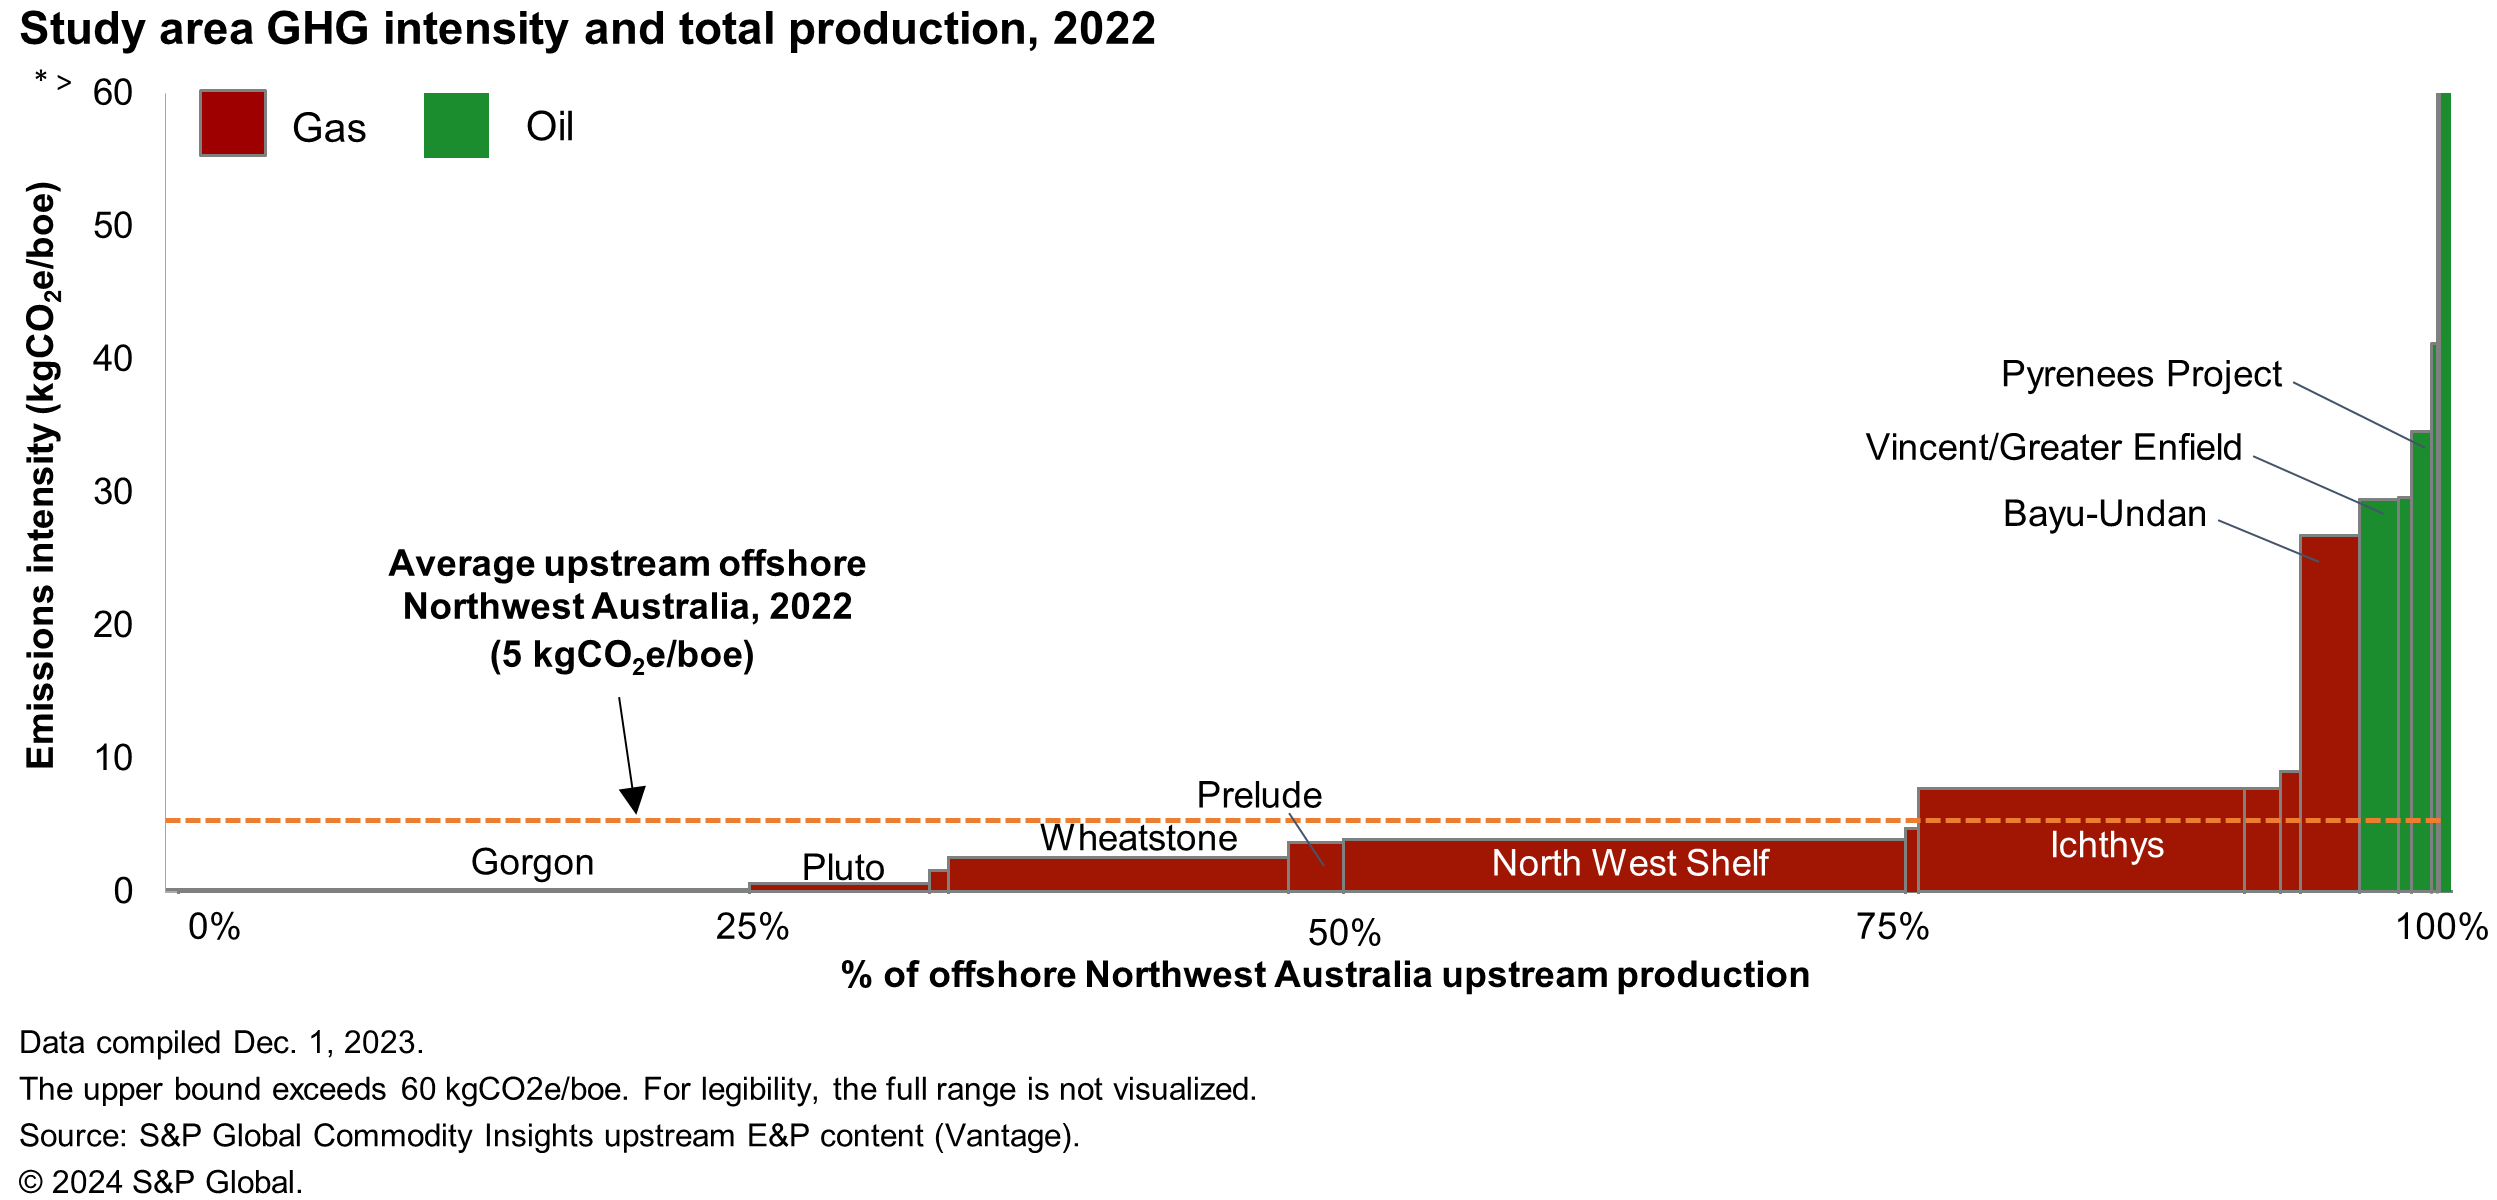
Similar to other basins worldwide, the emissions intensity at the asset level in the region varied significantly. It ranged from less than 1 kgCO2e/boe to 122 kgCO2e/boe, with eight assets contributing to about 77% of production, emitting less than the upstream regional average of 5 kgCO2e/boe. Additionally, there was a clear distinction between the gas-producing upstream assets (red bars) and the oil-producing upstream assets (green bars) in terms of emissions intensity, highlighting the significant difference in emissions intensity between oil and gas-producing assets in offshore Northwest Australia. The high emissions intensity of the oil assets was attributable to lower field production volumes than the gas assets, which led to more energy-intensive production per barrel of oil equivalent, as well as more intensive flaring and venting to remove the associated gas production than the gas assets.
When the contribution of an asset to the total absolute emissions is plotted against its share of the total production volume cumulatively, the tendency for larger assets to be more emission-efficient observed in the Gulf of Mexico and North Sea was also apparent in Northwest Australia. This is evident by the fact that the five largest assets by production volume, which accounted for more than 86% of the production volume, contributed less than half of the total upstream offshore emissions. This is similar to the Gulf of Mexico, where the 10 largest assets by production volume, which accounted for more than 50% of the total volume, were responsible for less than 30% of the total absolute emissions.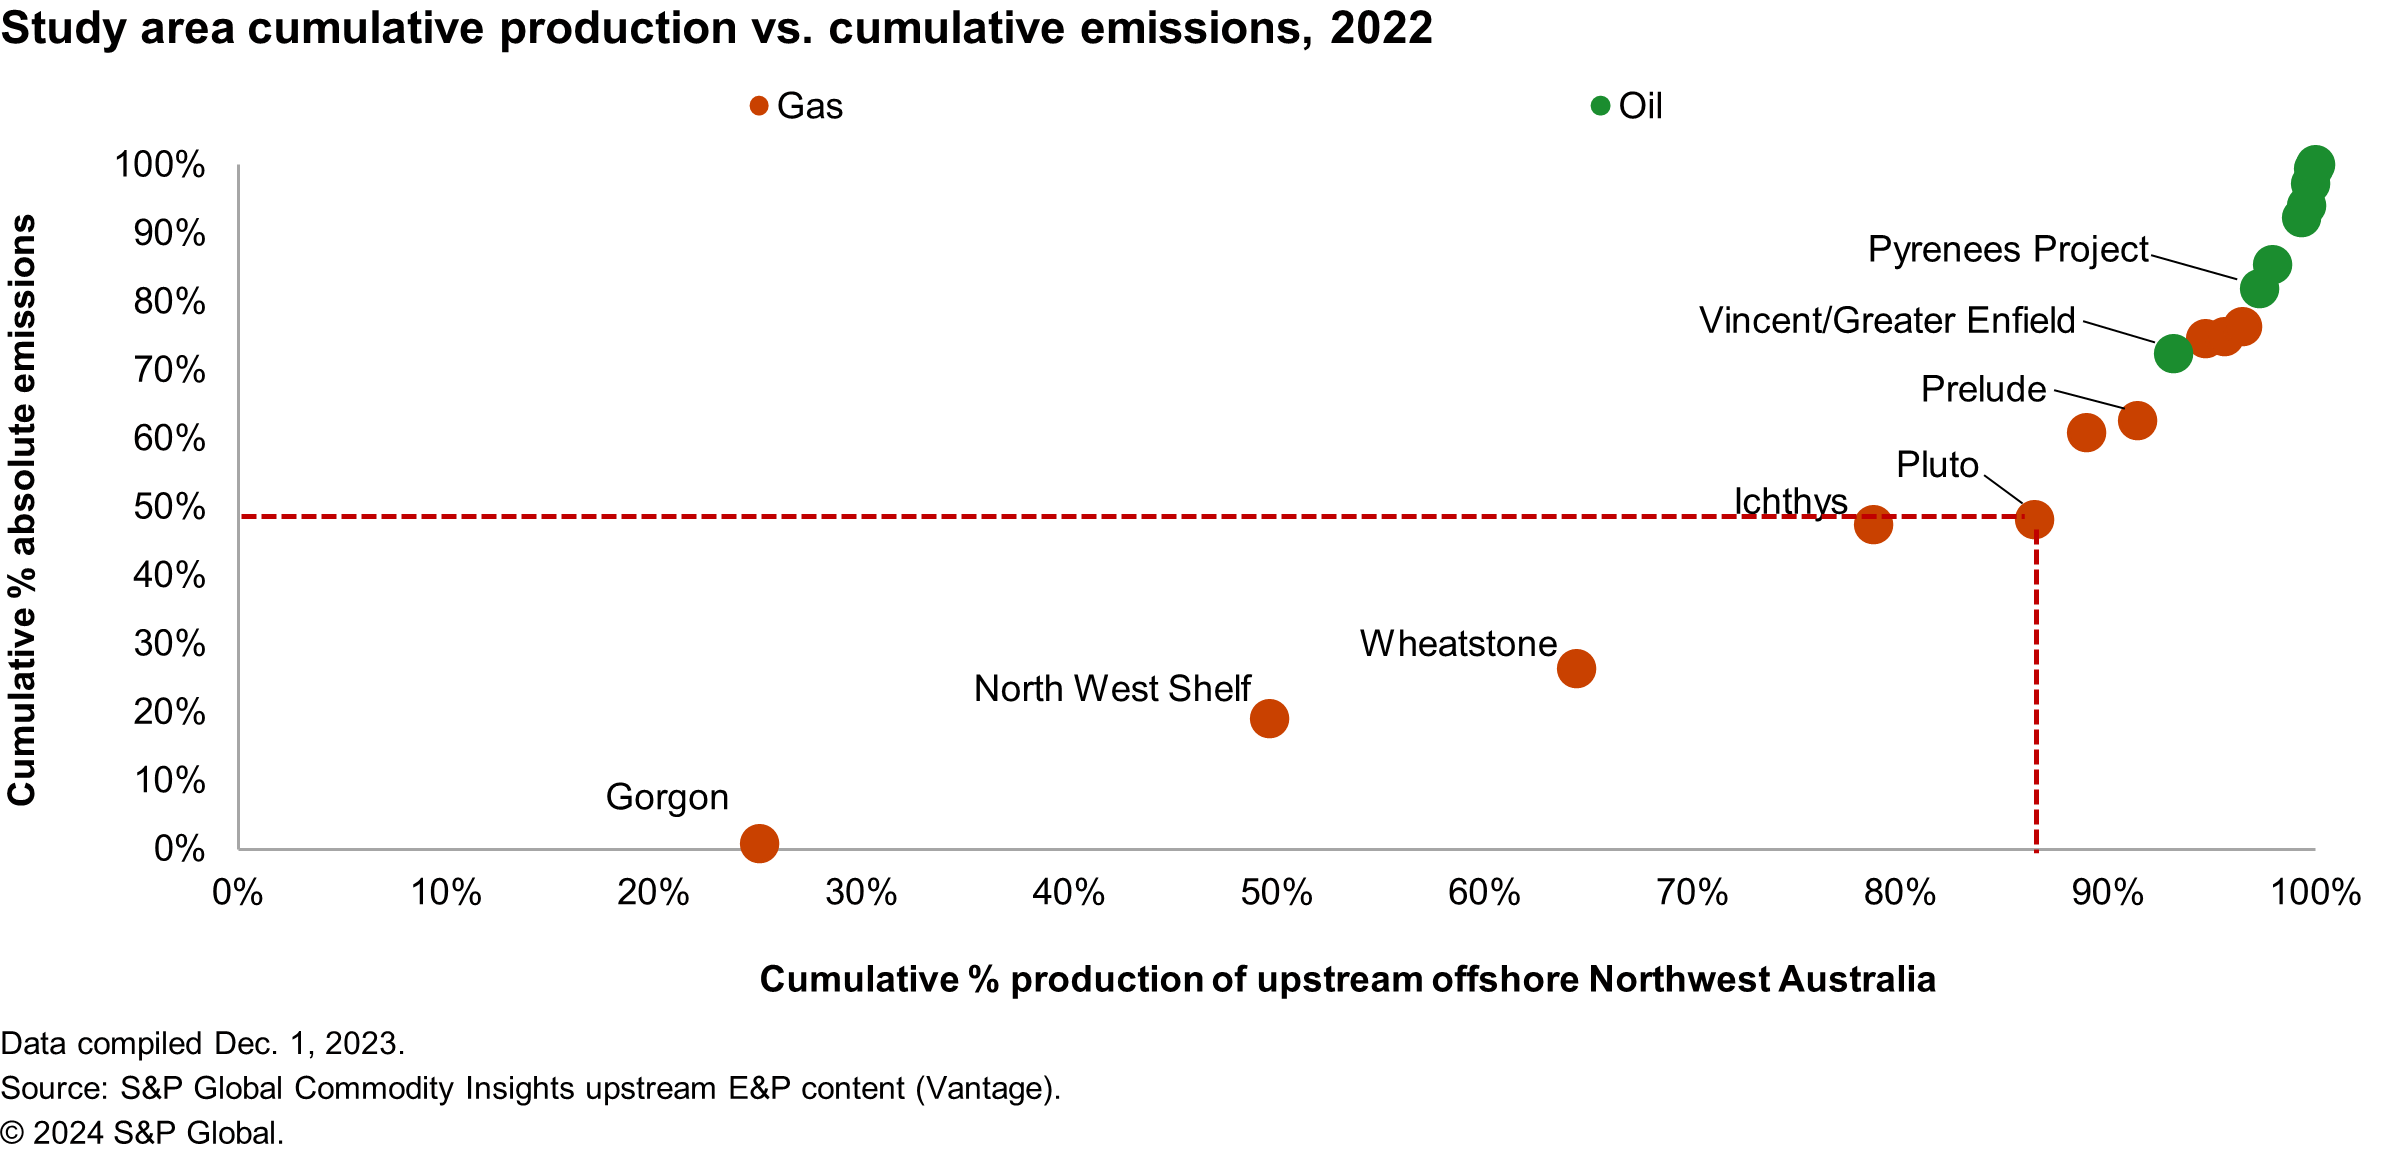
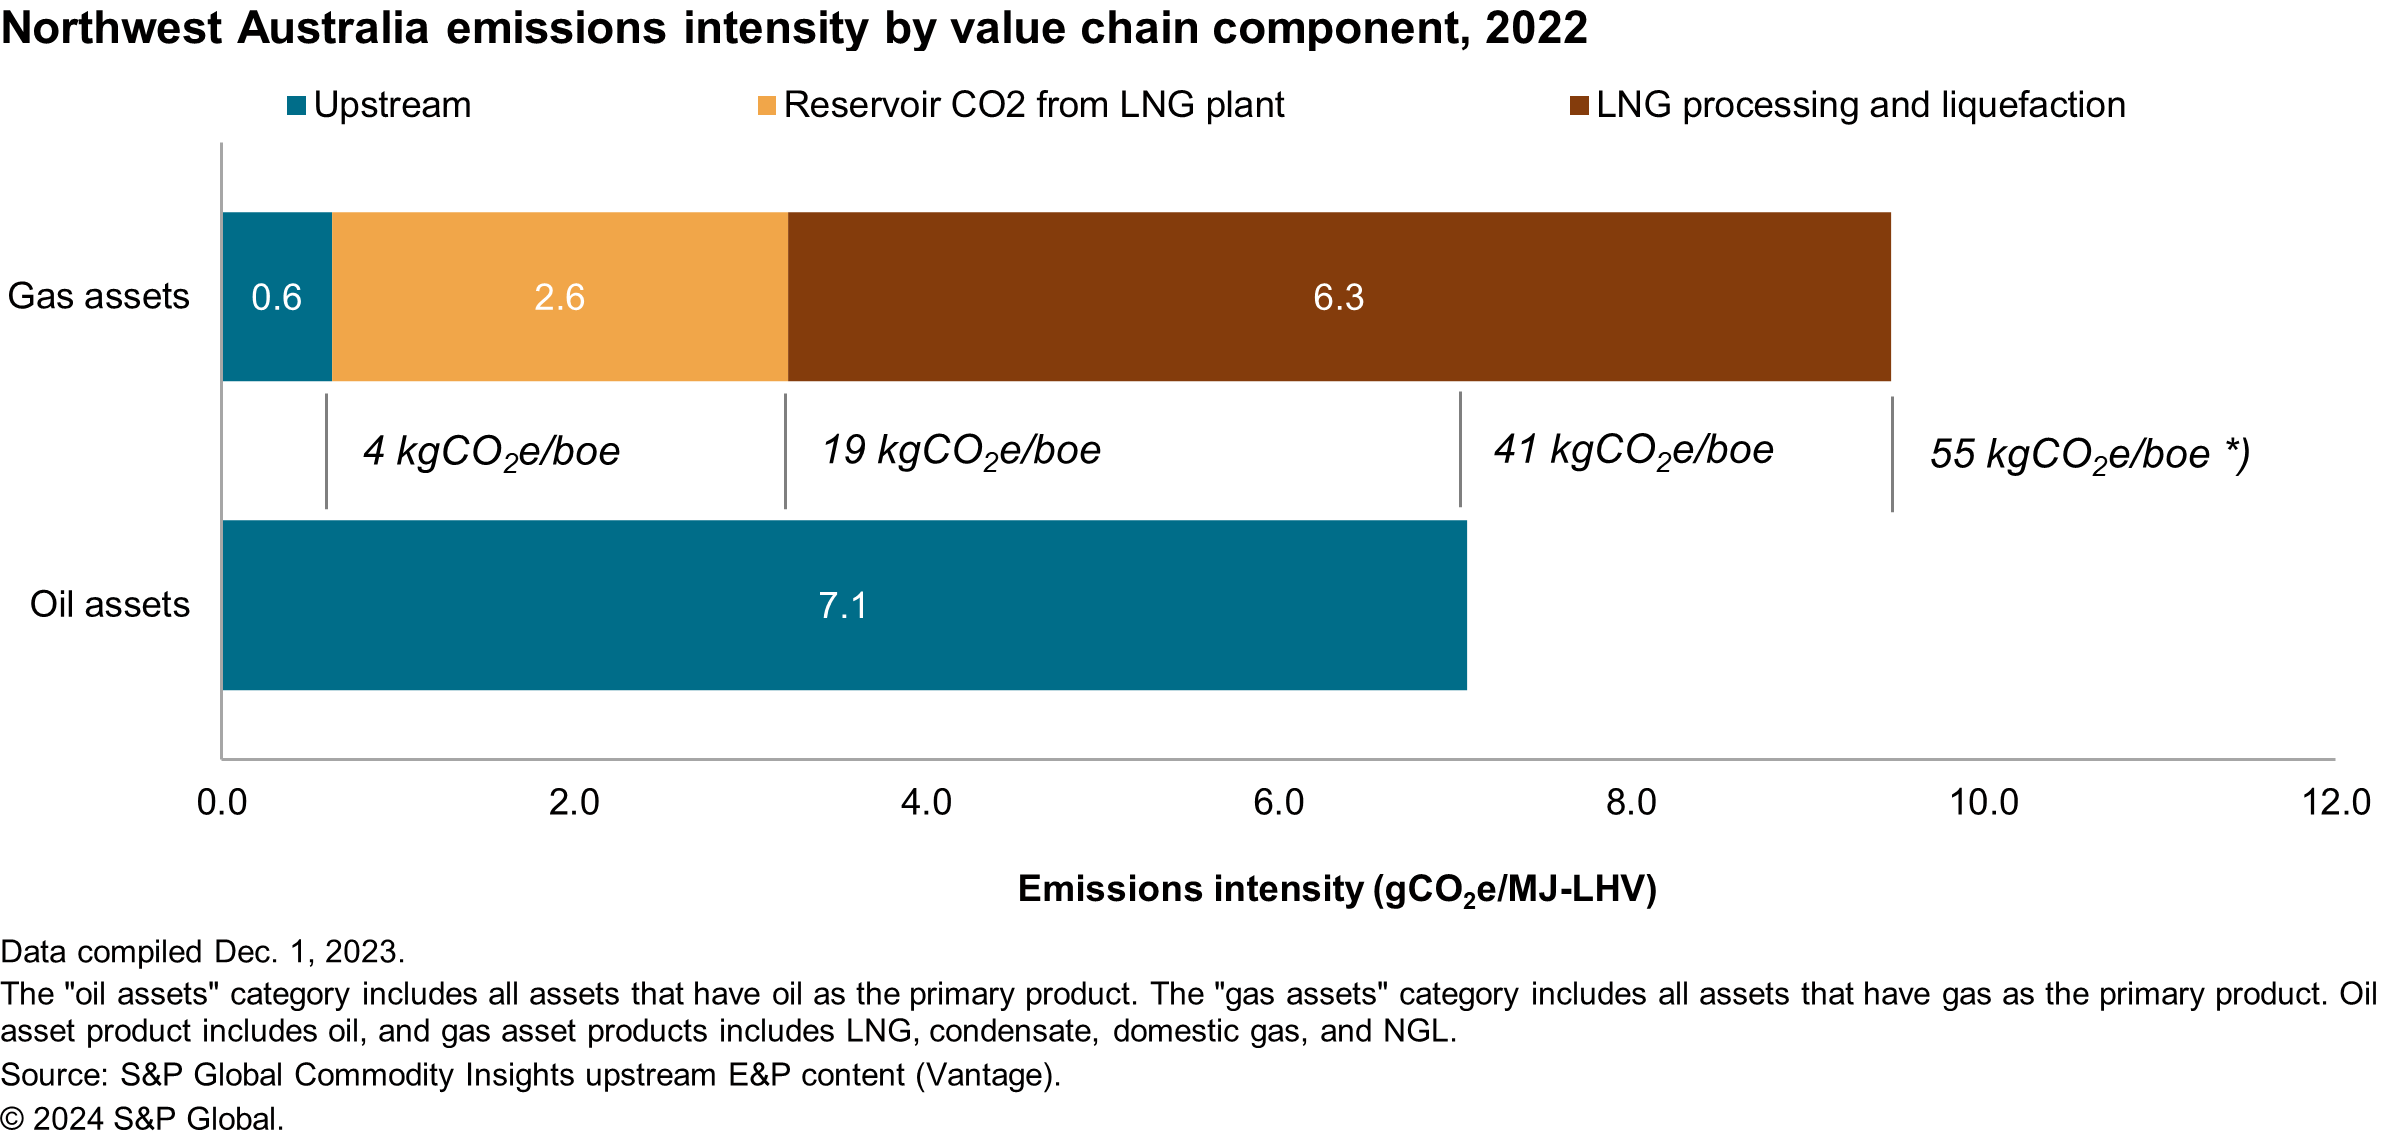
Regarding the emissions from gas assets, approximately 46% of Northwest Australia's 2022 gas assets' production came from fields with a reservoir CO2 content higher than 5%. These fields also supply feed gas to the LNG plants, which require the full removal of reservoir CO2 before the liquefaction process. With the absence of acid gas removal in these upstream facilities, all the produced reservoir CO2 is transferred to the LNG facilities to be removed at the processing plant and is not considered as upstream emissions. Therefore, it is essential to expand the scope of gas assets to include emissions from processing and liquefaction as an integrated Gas-LNG asset in order to obtain a complete picture of Northwest Australia's oil and gas emissions.
The LNG facilities in Northwest Australia were estimated to emit a total of 28.2 MMtCO2e in 2022, resulting in a production-weighted average emissions intensity of 52 kgCO2e/boe, or 8.8 gCO2e/MJ-LHV of produced product. By adding the emissions intensity of the upstream gas assets, the total integrated gas-LNG emissions intensity was 55 kgCO2e/boe or 9.5 gCO2e/MJ-LHV, which was higher than the emissions intensity of upstream oil assets. Furthermore, when considering the emissions from reservoir CO2 venting alone, the region's overall reservoir CO2 emissions intensity was approximately 15 kgCO2e/boe (2.6 gCO2e/MJ-LHV). Adding this to the upstream gas emissions intensity resulted in 19 kgCO2e/boe (3.2 gCO2e/MJ-LHV), which was still lower than the emissions intensity of the offshore Northwest Australia oil assets but exceeded the average performance of the North Sea and Gulf of Mexico.
Evaluating the total proportion of emissions by source for upstream assets shows that approximately 8% of the upstream oil assets' emissions originated from venting, while only 3% of the upstream gas assets' emissions originated from the same source. This results in a venting intensity of approximately 3 kgCO2e/boe for oil assets and less than 1 kgCO2e/boe for gas assets. The very low venting activity of gas assets was due to the fact that all upstream gas assets do not perform acid gas separation offshore but instead transfer the acid gas to the LNG plant for removal, thereby shifting the venting emissions to the midstream process. Including LNG facility emissions for comparison, the venting intensity of LNG plants was approximately 16 kgCO2e/boe, with the majority of venting emissions originating from the acid gas (reservoir CO2) removal process that shared 29% of LNG plants emissions. This demonstrates the significance of considering midstream liquefaction and processing facilities when evaluating oil and gas production emissions, especially when assessing assets with high reservoir CO2 fields. Furthermore, the high contribution of reservoir CO2 to LNG plants' total emissions also emphasizes the importance of CCS development in the region.
Energy comprehensive and rapidly evolving GHG modeling capabilities enabled analysis of the Scope 1 emissions profiles of all major producing assets offshore Northwest Australia in 2022, providing timely insight into the GHG intensity of one of the world's most significant regions for LNG production. This insight is part of a continuing series of analyses from Energy upstream GHG dataset. Find out more in the insight piece here.
Key implications
- Assessment of 20 assets shows that the estimated production weighted average emissions intensity of offshore Northwest Australia oil and gas upstream production in 2022 was 5 kilograms of CO2 equivalent per barrel of oil equivalent (kgCO2e/boe). There was a significant variance in asset-level emissions intensity throughout the region, ranging from less than 1 kgCO2e/boe to 122 kgCO2e/boe.
- Producing assets were categorized by primary product to evaluate the emissions intensity. On average, upstream facilities with oil as the primary product were more emissions-intensive than those producing gas. Nonetheless, the region's emissions performance was heavily influenced by the gas assets. These gas assets represented 96% of the total production, with a weighted average emissions intensity of 4 kgCO2e/boe, while the oil assets had an emissions intensity of 41 kgCO2e/boe.
- The emissions intensity of eight assets, which accounted for about 77% of the total production volume, were below the region's average, whereas the five largest asset hubs that shared 86% of the total production contributed to approximately 48% of the region's upstream total emissions.
- The LNG facilities' emissions intensity was estimated to be 8.8 grams of CO2 equivalent per megajoules of lower heating value (gCO2e/MJ-LHV) of produced product or equivalent to 52 kgCO2e/boe, resulting in the integrated gas-LNG emissions intensity of about 55 kgCO2e/boe. Reservoir CO2 emissions contributed to 29% of the overall LNG's emissions or about 2.6 gCO2e/MJ-LHV (15 kgCO2e/boe).
- LNG facilities' had a significantly higher venting intensity of 16 kgCO2e/boe than upstream assets, with a venting emissions intensity of less than 1 kgCO2e/boe for gas assets and about 3 kgCO2e/boe for oil assets. Most venting emissions of LNG facilities originated from the acid gas (reservoir CO2) removal process due to the requirement of complete CO2 removal.
This article was published by S&P Global Energy and not by S&P Global Ratings, which is a separately managed division of S&P Global.