Customer Logins

Obtain the data you need to make the most informed decisions by accessing our extensive portfolio of information, analytics, and expertise. Sign in to the product or service center of your choice.

Customer Logins

My Logins

All Customer Logins
S&P Global Commodity Insights
  • S&P Global
  • S&P Dow Jones Indices
  • S&P Global Market Intelligence
  • S&P Global Mobility
  • S&P Global Commodity Insights
  • S&P Global Ratings
  • S&P Global Sustainable1
Close
Discover more about S&P Global’s offerings.
Investor Relations
  • Investor Relations Overview
  • Presentations
  • Investor Fact Book
  • News Releases
  • Quarterly Earnings
  • SEC Filings & Reports
  • Executive Committee
  • Merger Information
  • Governance
  • Stock & Dividends
  • Shareholder Services
  • Contact
English
  • Español
  • 中文网站
  • Português
  • 한국어
  • हिंदी
  • English (Australia)
  • 日本語
Support
  • Get Support
  • System Notifications
  • Delivery Platforms
  • Regulatory Engagement
Login
  • Commodity Insights Login
  • Access IHS Markit Products
login
Register
logo
  • Commodities
  • Products & Services
  • Methodology
  • Market Insights
  • Energy Transition
  • Events
  • S&P Global
  • S&P Dow Jones Indices
  • S&P Global Market Intelligence
  • S&P Global Mobility
  • S&P Global Commodity Insights
  • S&P Global Ratings
  • S&P Global Sustainable1
  • Oil Upstream LNG Natural Gas Electric Power Coal Shipping Chemicals Metals Agriculture
    Latest in Commodities
    Listen: Lithium producers pump brakes on North American projects amid low prices

    Lithium producers are pushing timelines out for project development in North America as global...

    LPG outlook hinges on petchem demand growth, LNG supply security

    As the heating season drew to a close the LPG market was already eyeing the outlook for next winter,...

  • Oil LNG Natural Gas Electric Power Coal Shipping Chemicals Metals Agriculture Energy Transition
    I Need
    Market Insights and Analytics Advisory Solutions/Consulting Commodity Prices and Essential Market Data Real-Time News, Prices and Analysis Forward Curves and Risk Valuation Data
    Latest Release Notes
    Data and Distribution
  • Our Methodology Methodology & Specifications Price Assessments Subscriber Notes Price Symbols Symbol Search & Directories Corrections Complaints
    References
    Market On Close Index Sourced Data (Survey) Methodology Review & Change MOC Participation Guidelines Holiday Dunl.org SEE ALL REFERENCE TOOLS
  • Latest News Headlines All Topics Videos Podcasts Special Reports Infographics Insights Magazine Insight Blog    Research & Analysis
    Latest in Market Insights
  • PLATTS ANALYTICS PRODUCT PLATFORM
    ACCESS ANALYTICS HUB
  • All Events Webinars Conferences Methodology Education Training and eLearning Conferences Live Global Energy Awards    CERAWeek
    Featured Events
    Forums S&P Global Commodity Insights at the 2024 AFPM Annual Meeting
    • 11 Mar 2024
    • Grapevine, TX
    Forums World Petrochemical Conference
    • 11 Mar 2024
    • Grapevine, TX
    Forums CERAWeek
    • 11 Mar 2024
    • Grapevine, TX
BLOG Jan 31, 2022

Canadian oil sands continue their GHG intensity decline

Contributor Image
Kevin Birn

Despite significant COVID-19 led market disruptions the GHG intensity of the Canadian oil sands declined again in 2020. Altogether it has dropped 20 percent between 2009 and 2020. This is an important signal, as preliminary finding from an advancing IHS Markit report indicate ongoing GHG intensity reductions are poised to overtake a slowing oil sands growth profile and absolute emission could begin to decline within the next half decade.

The 2020 results confirm the long-term trend of declining GHG intensity of the Canadian oil sands. Since 2009 (the earliest IHS Markit models capture) the industry has seen the average GHG intensity decline by just over 1.5 kgCO2e/bbl per year. In total this equates to a drop of about 17 kgCO2e/bbl or 20% from 2009 to 2020.

GHG intensity is the ratio of absolute GHG emissions divided by production—so it fluctuates based not only emissions, but also productivity. Over the past decade it was a combination of both factors that has led to the steady decline. Oil sands mining operations have scored the greater improvements.

Since 2009, only once has the average GHG intensity increased. Surprisingly this was not in 2020, but back in 2012. The fact that GHG intensity continued to decline in 2020 is particularly noteworthy. This occurred despite the industry undergoing the single largest production contraction in its history because of the COVID 19 demand shock. From January 2020 to May, production plummeted by nearly 800,000 b/d or about 20% before beginning to recover. This instability would drive down facility utilization which in turn would put upward pressure on GHG intensity (think about using similar levels of energy but with fewer units being produced).

In 2020, however the average GHG intensity of the oil sands still declined. To a large degree, this was the result of changes in production between different types of extraction. In 2020, the share of the comparatively more GHG intensive legacy integrated mining operations which market synthetic crude oil temporarily declined relative to the comparatively lower GHG intensive thermal in-situ operations (specifically steam-assisted gravity drainage projects or SAGD).

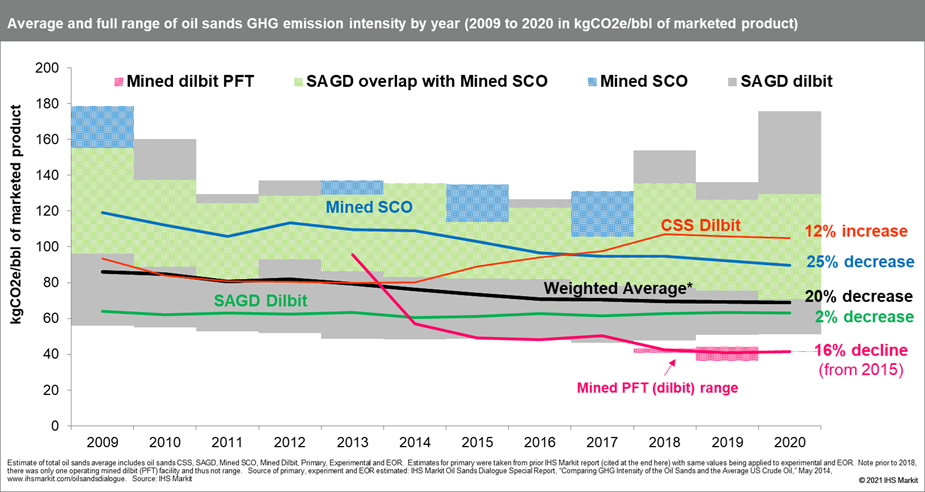
In 2020, IHS Markit estimated the average GHG intensity of marketable oil sands produced average 69 kgCO2e/bbl. However, within any upstream oil and gas plays there can be considerable variability in GHG intensity. In 2020, the variation in the Canadian oil sands emissions was the greatest it's been in many years as the ramping down of some operations did have the expected result of causing temporary spikes in GHG intensity. However, the volumes impacted were relatively limited which muted the impact on the overall average. In total in 2020 the Canadian oil sands included output that ranged from 41 kgCO2e/bbl to 175 kgCO2e/bbl.

Increasingly the Canadian oil sands industry has begun to focus on absolute GHG emissions. A consortium of major oil sands producers that represent over 95% of industry output have announced an ambition to get to Net-Zero by 2050. This is unique in that the private operators that constitute nearly the entire basin have come together to announce a shared ambition. Known as the Oil Sands Pathways to Net Zero, their interim target includes lowering absolute GHG emissions by 22 MMtCO2e by 2030 relative to 2018. Meanwhile the Government of Canada announced its intention to cap upstream oil and gas GHG emissions which would include the Canadian oil sands. These efforts indicate greater levels of reduction should be anticipated in the future.

The ramp-up of existing underutilized through the early 2020s has put upward pressure on absolute GHG emissions. However, an upcoming IHS Markit report indicates that ongoing GHG intensity reductions are poised to overtake a slowing growth profile and contribute to absolute emission reductions within the next half decade. Moreover, new initiatives like the Oil Sands Pathways to Net Zero are looking at ways to accelerate the deployment of carbon capture and storage that could result is larger, more material reductions towards the late 2020s.

This IHS Markit blog will be followed by an upcoming IHS Markit Special Report on the trajectory of GHG emission intensity and the absolute emissions of the Canadian oil sands. IHS Markit analysis does not consider the implications of recently announced federal cap on oil and gas emissions.

Please note IHS Markit oil sands GHG emissions estimates are derived from a purpose-built oil sands model inclusive of all thermal and mining operations in the oil sands. GHG intensity metrics are presented with GHG emissions system boundaries consistent with the life-cycle stage of upstream production. This definition includes emissions associated with production of fuels used in oil sands operations and export or import of electricity from the power grid.

Posted 31 January 2022 by Kevin Birn, Global Head, Center of Emissions Excellence and Chief Analyst Canadian Oil Markets, S&P Global Commodity Insights


This article was published by S&P Global Commodity Insights and not by S&P Global Ratings, which is a separately managed division of S&P Global.

Previous Next
Recommended for you

Energy Solutions
Consulting
Upstream Oil & Gas
Subscribe to the Blog

Receive monthly energy insights from our blog right in your inbox.

Subscribe

CERAWeek 2024

Multidimensional Energy Transition: Markets, climate, technology and geopolitics
March 6 – 10 in Houston, TX

LEARN MORE
Related Posts
VIEW ALL
Blog Mar 08, 2024

No newbuild cycle? No problem...

Blog Mar 05, 2024

Natural gas as part of utilities’ low-carbon strategy

Blog Mar 01, 2024

Construction vessels gear up for work in Australia

VIEW ALL
{"items" : [ {"name":"share","enabled":true,"desc":"<strong>Share</strong>","mobdesc":"Share","options":[ {"name":"facebook","url":"https://www.facebook.com/sharer.php?u=http%3a%2f%2fwww.spglobal.com%2fcommodityinsights%2fen%2fci%2fresearch-analysis%2fcanadian-oil-sands-continue-their-ghg-intensity-decline.html","enabled":true},{"name":"twitter","url":"https://twitter.com/intent/tweet?url=http%3a%2f%2fwww.spglobal.com%2fcommodityinsights%2fen%2fci%2fresearch-analysis%2fcanadian-oil-sands-continue-their-ghg-intensity-decline.html&text=Canadian+oil+sands+continue+their+GHG+intensity+decline+%7c+S%26P+Global+","enabled":true},{"name":"linkedin","url":"https://www.linkedin.com/sharing/share-offsite/?url=http%3a%2f%2fwww.spglobal.com%2fcommodityinsights%2fen%2fci%2fresearch-analysis%2fcanadian-oil-sands-continue-their-ghg-intensity-decline.html","enabled":true},{"name":"email","url":"?subject=Canadian oil sands continue their GHG intensity decline | S&P Global &body=http%3a%2f%2fwww.spglobal.com%2fcommodityinsights%2fen%2fci%2fresearch-analysis%2fcanadian-oil-sands-continue-their-ghg-intensity-decline.html","enabled":true},{"name":"whatsapp","url":"https://api.whatsapp.com/send?text=Canadian+oil+sands+continue+their+GHG+intensity+decline+%7c+S%26P+Global+ http%3a%2f%2fwww.spglobal.com%2fcommodityinsights%2fen%2fci%2fresearch-analysis%2fcanadian-oil-sands-continue-their-ghg-intensity-decline.html","enabled":true}]}, {"name":"rtt","enabled":true,"mobdesc":"Top"} ]}
Filter Sort
  • About S&P Global Commodity Insights
  • Media Center
  • Advertisers
  • Locations
  • Get Support
  • Contact Us
  • Careers
  • Corporate Responsibility
  • History
  • Investor Relations
  • Leadership
  • Glossary
  • © 2024 by S&P Global Inc. All rights reserved.
  • Terms of Use
  • Do Not Sell My Personal Information
  • Privacy Policy & Cookie Notice
  • Site Map