


30 Apr 2020 | 20:21 UTC — New York
Analysis: US oil, gas rig count falls 59 to 432 as oil collapse extends
By Chris van Moessner and Starr Spencer
Highlights
Active oil rigs fall 56 to 315
Rig count could fall another 22%-44%: Cowen survey
US crude output down 1 million b/d from March peak
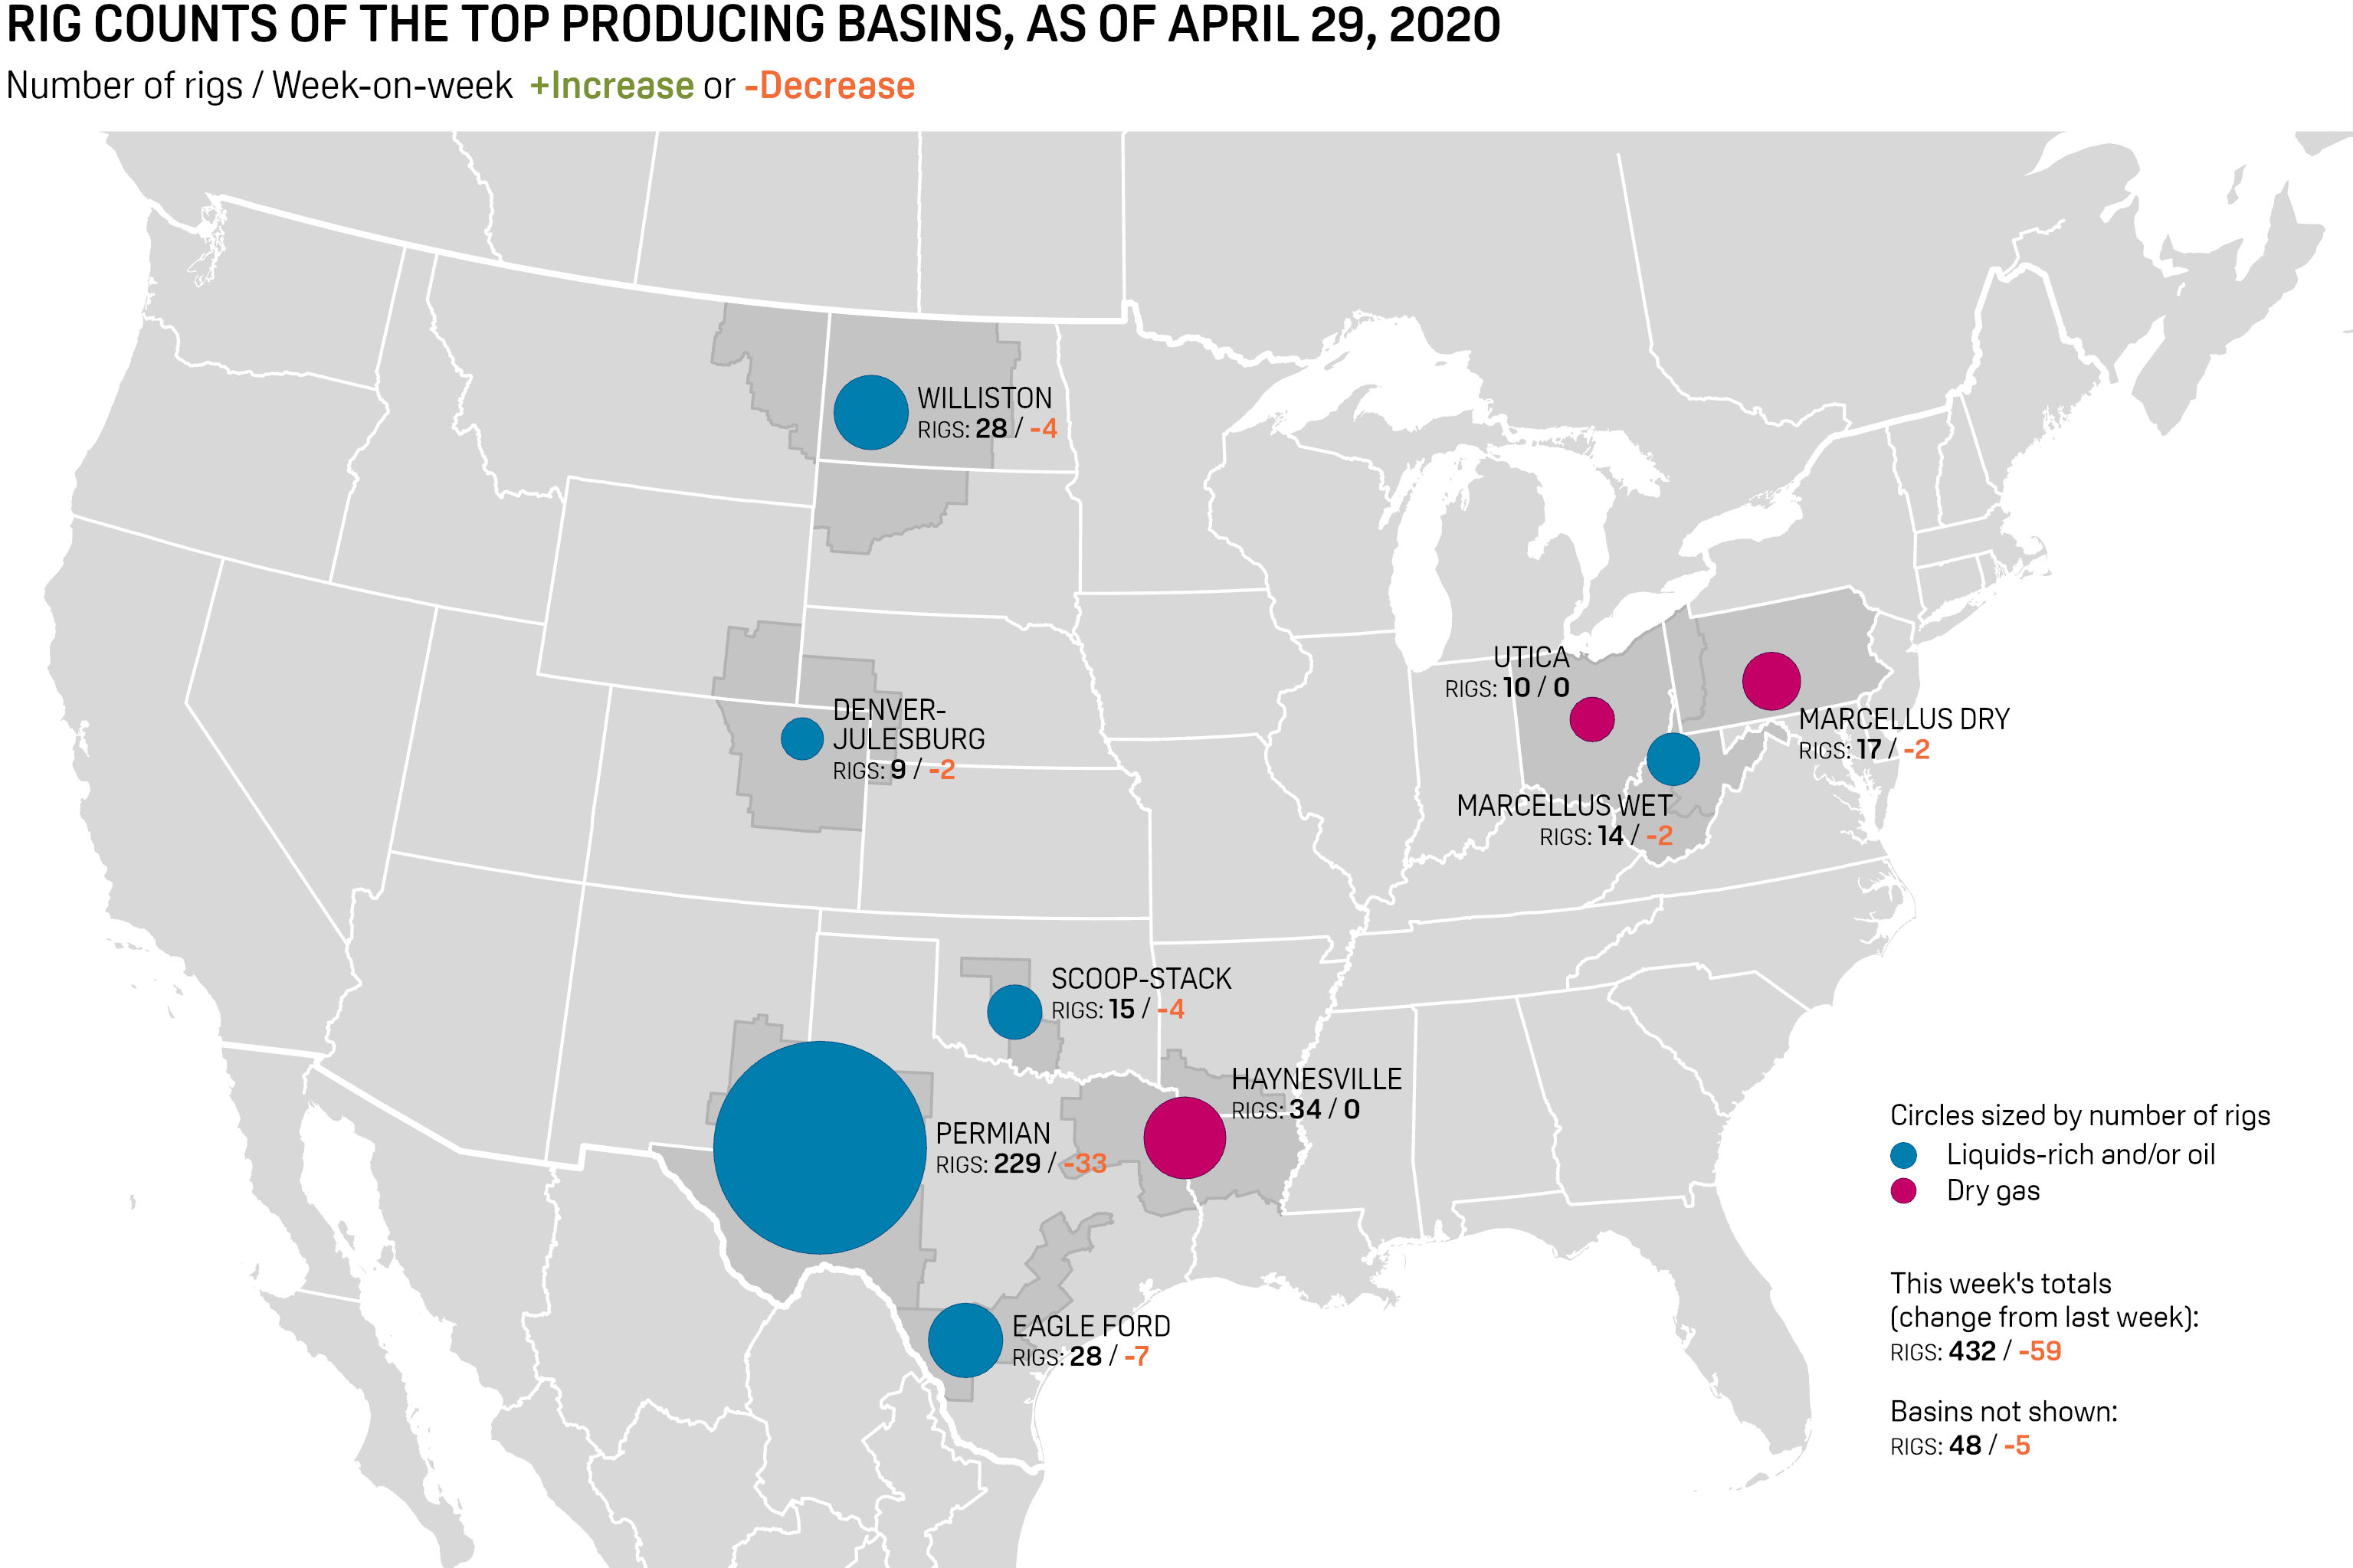
New York — The US oil and gas rig count fell 59 to 432 during the week ended April 29, rig data provider Enverus said Thursday, as upstream players continued to idle oil rigs in response to sustained lower crude prices.
The decline was concentrated almost solely in the number of rigs chasing oil, which fell 56 to 315, while the gas-focused rig count dipped only three to 117.
The total US rig counts has almost been halved since March 11, with rig totals falling 48%, or 403, from 835, in response to a steep decline in crude prices.
Front-month WTI is down nearly 65% from its most recent peak in mid-February, and Platts Midland crude has lost nearly 68% of its value over the same period.
The number of rigs active in the Permian Basin was down 33 at 229 last week, fully 47% lower than during the same period last year.
The Permian has seen rig totals drop by 47% since the first week of March, plummeting 200 rigs from a total 429 rigs.
In the Eagle Ford play, rig counts fell seven week on week to 28, a 66% decline from year-ago. Eagle Ford rig totals are down 65%, or 51 rigs, from 79 total rigs March 4.
Operators idled four rigs in the Williston basin, putting the total there to 28, while the number of rigs active in the Denver-Julesburg play fell by two to nine, down 70% from the same period last year.
Rig counts in Anadarko's SCOOP-STACK basin were down 83% from year-ago levels after a four-rig decline last week put the total count there at 15.
In the eastern part of the country, the Marcellus rig count fell four to 31, and the number of rigs active in the Utica play was again unchanged on week at 10.
Click here for full-size image

RIG DECLINES LIKELY TO EXTEND
A survey by investment bank Cowen of 83 investors and industry participants found sentiment more bearish on North American activity than is currently reflected by the market.
The US rig count is likely to bottom at around 250-350 land rigs, according to 44% of respondents, down a further 22%-44% compared to the 448 in last Friday's Baker Hughes rig count.
Baker Hughes publishes a separate weekly rig count on Friday applying a different methodology to Enverus data.
PRODUCTION SLIDING
As rigs decline, so, too, has production, with operators shutting in low-margin wells.
According to separate estimates, investment bank Tudor Pickering Holt calculates the US' shut-in oil production currently at around 700,000 b/d, while S&P Global Platts Analytics has calculated a figure closer to 800,000 b/d.
Apart from shut-in wells, production could also decline from lack of drilling and rigs that left the field, WTRG president James Williams said.
"If the rig count and [well] completion rates stay at last Friday's level, oil production from shale plays decline over 400,000 b/d in July," he said.
Total US crude production fell 100,000 b/d to 12.1 million b/d during the week ended April 24, US Energy Information Administration data showed Wednesday.
Weekly output was at its lowest level since July 2019 and was down by 1 million b/d from an all-time high of 13.1 million b/d in late March.
US producers need to shut in over 3 million b/d of output over the next two to three months to offset demand declines stemming from the COVID-19 pandemic, according to Platts Analytics.
While upstream operators have slashed capex budgets and rigs counts, compared to March's production level of 8.4 million b/d, US shale oil is expected to decline only 800,000 b/d by year's end and 1.9 million b/d by end-2021.
However, storage constraints are likely to shut in more production in the near term. Storage tanks at Cushing, Oklahoma, are approximately 81% full as of the week ended April 24, an S&P Global Platts analysis shows.
Editor: