


14 May 2020 | 19:54 UTC — Houston
US oil, gas rig count falls 29 to 369 in 9th straight week of double-digit drops: Enverus

Highlights
All shed rigs were oil-prone; gas rigs up one
Permian rigs fall below 200
Drilling slowdown to be felt most in Q2
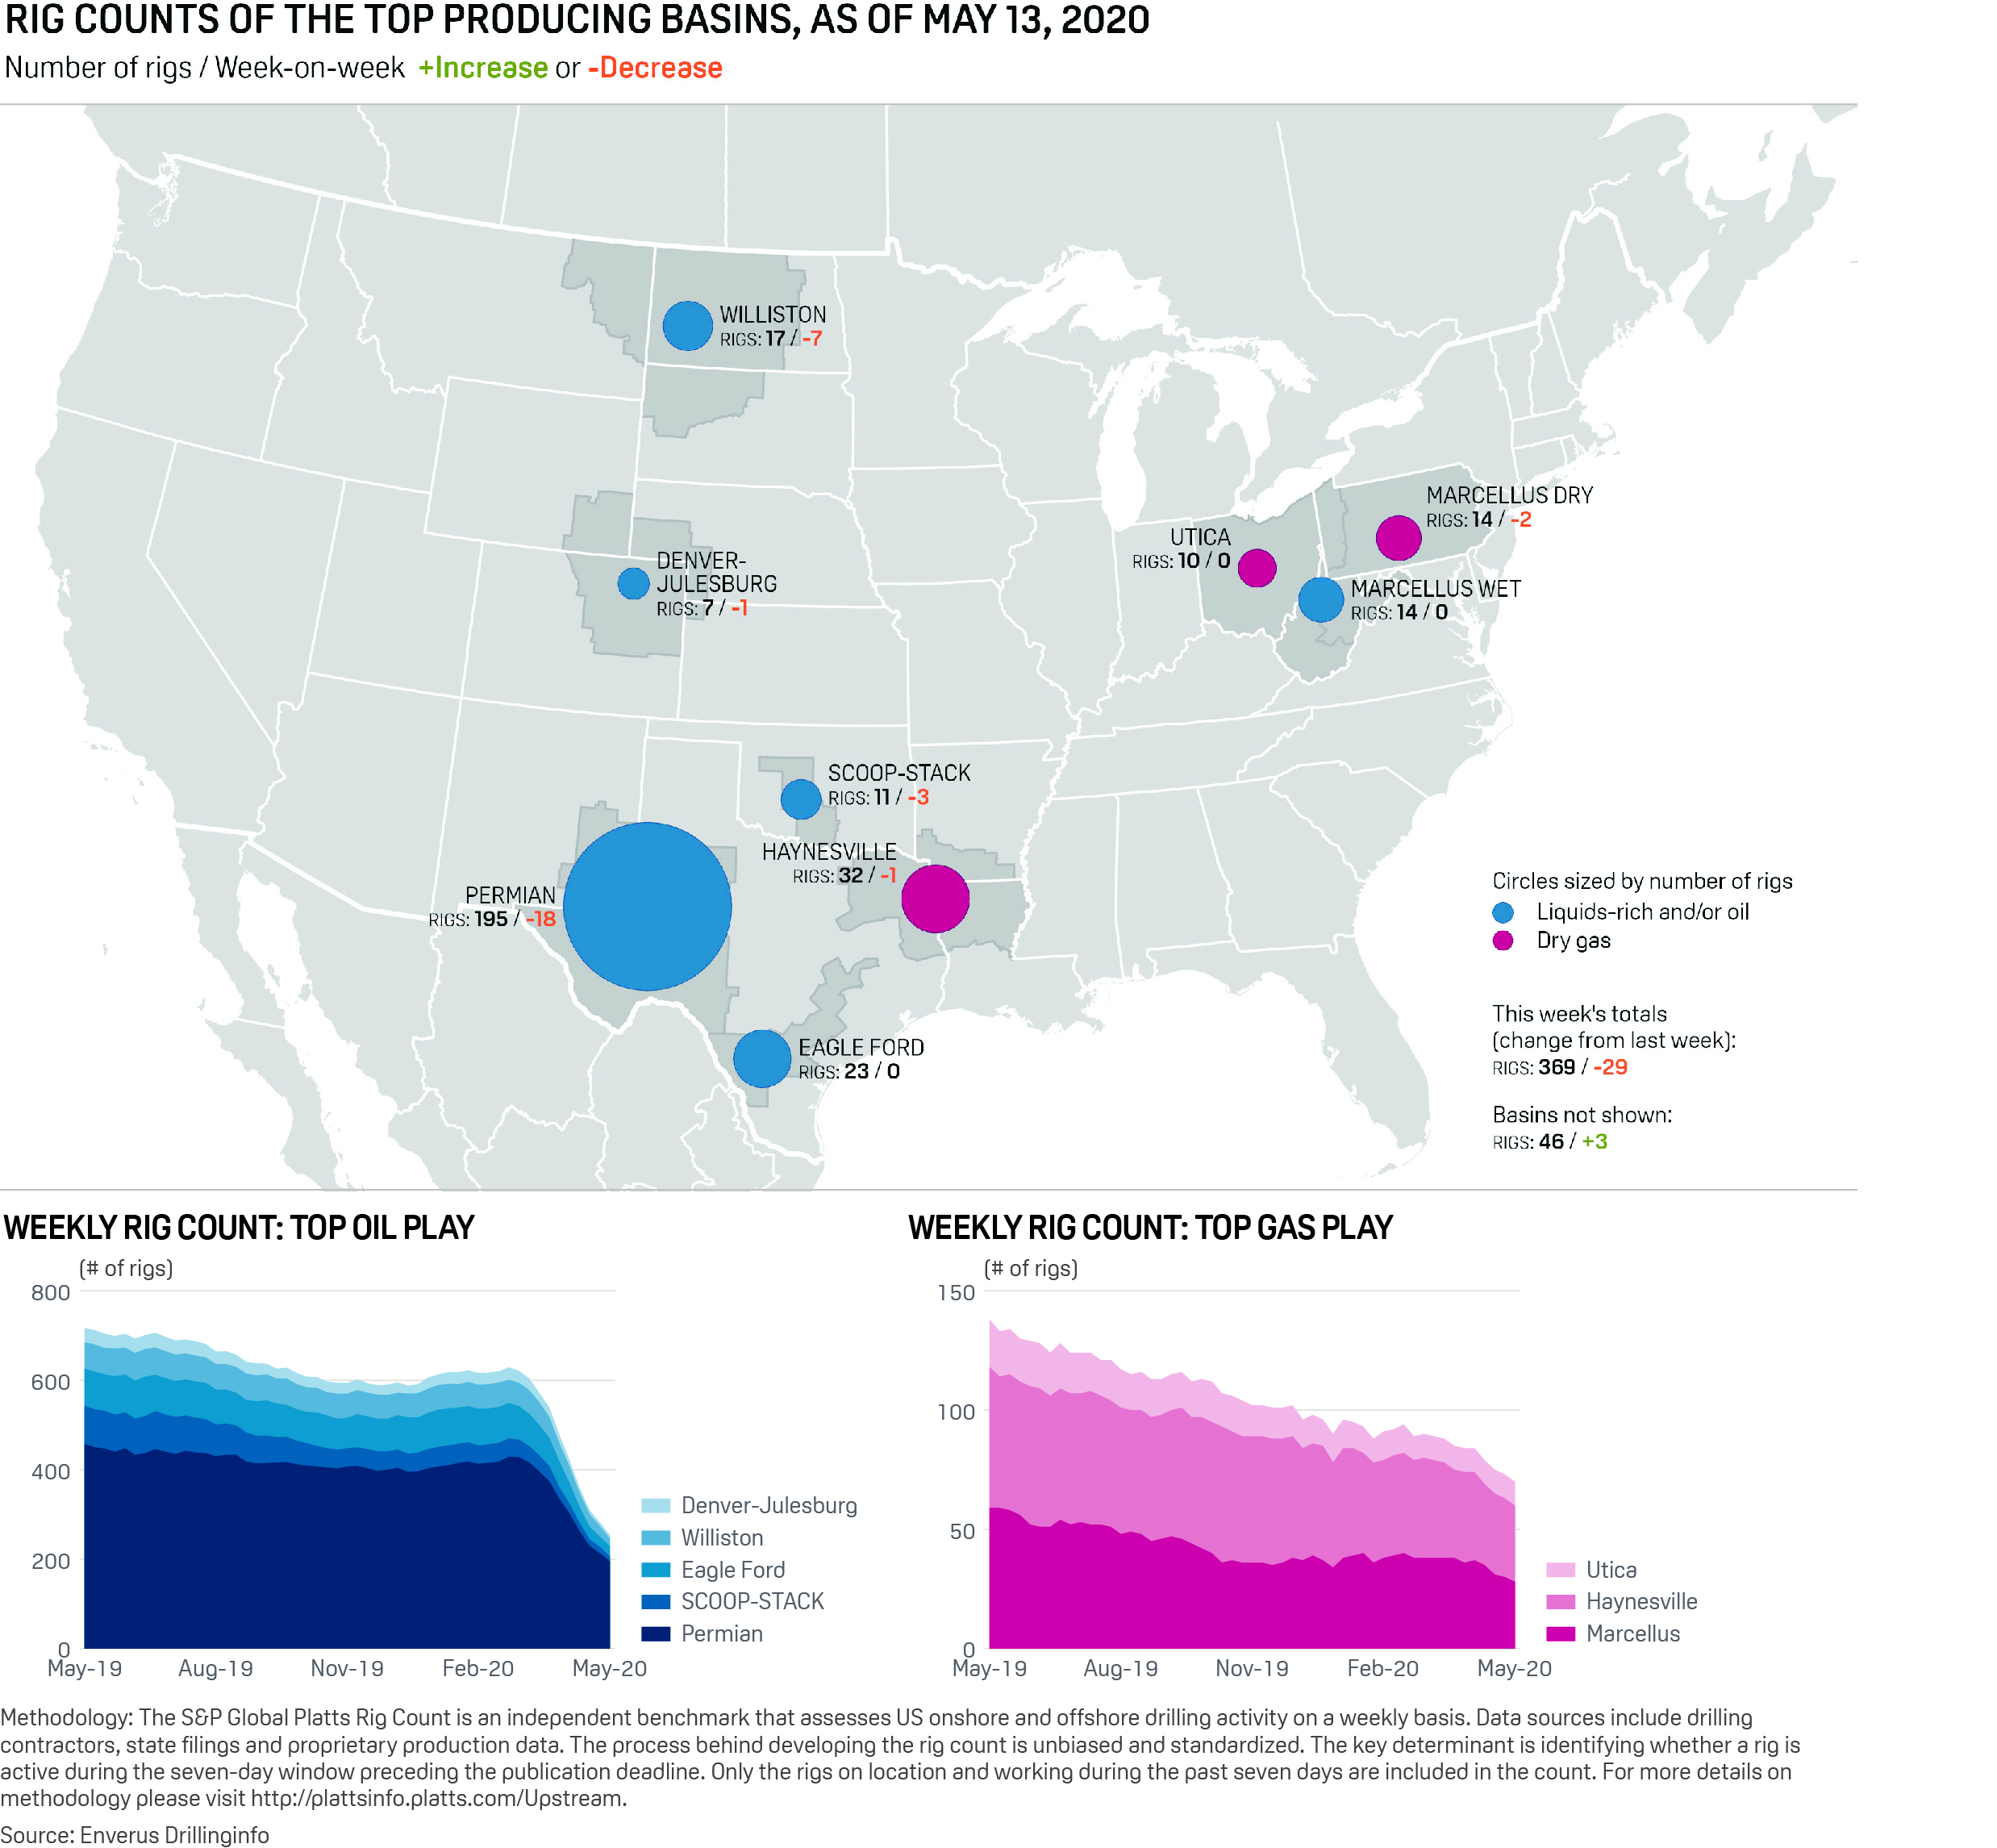
Houston — The total US oil and gas rig count fell 29 to 369 on the week, rig data provider Enverus said Thursday, marking the ninth straight week of double-digit declines as the industry downturn continued deepening from the coronavirus pandemic.
The weekly drop came entirely from a decline in oil-focused rigs, which fell by 30 to 256. Natural gas-weighted rigs rose by one to 113, Enverus said, with the gain coming from outside the eight named large basins.
Since mid-March, the rig count has slipped 55% from 835. Oil prices during that span toppled from about $46/b early that month to the low $30s/b within a week and then into the low $20/s in two weeks.
Over 450 US rigs have gone offline since early March, Enverus data shows.
Click here for full-size image

"Our forecast assumes rigs will continue to fall through the third quarter, but the rate of the decrease will slow down," Matt Andre, an analyst for S&P Global Platts Analytics, said. "Then we assume relatively flat rigs until the beginning of 2022 when they pick back up.
"We don't expect producers to rush to bring rigs back until demand and prices come back," Andre said.
Since oil prices plunged in mid-March, upstream producers have cut their capital budgets, with larger operators slashing spending by about 20%, to nearly 100% cuts by smaller producers, the Dallas Fed noted in a Thursday report.
The Fed said most of the expenditure cuts are front-loaded, and the impact from lower drilling activity will be felt mostly in Q2 2020.
Most companies have left the door open for additional cuts, the Fed notes, but some have said they could ramp up spending later this year if WTI prices go above $30/b or $35/b. Oil has been in the mid-$20s/b for the past week. On Thursday afternoon, NYMEX crude futures were trading above $27/b.
According to S&P Global Platts Analytics, WTI averaged $24.70/b this week, up $3.19 on week. WTI Midland prices averaged $27.13/b, up $2.99 on week, and the Bakken Composite price averaged $26.58/b, up $1.79.
For gas, prices at Henry Hub averaged $1.69/MMBtu, down 9 cents on week, while Dominion South prices averaged $1.34/MMBtu, down 10 cents.
PERMIAN DROPS BY 18 RIGS
The single largest tranche of rigs shed this week came from the Permian Basin of West Texas/Southeast New Mexico, which lost 18 rigs and dropped to 195, a level not seen in several years. The last time Permian rigs were this low was in early August 2016, when 196 rigs worked there.
As recently as the first week of March 2020, the Permian rig count was 429.
The Williston Basin of North Dakota/Montana was down seven rigs to 17, also a low not seen in years. The basin was lower than this week, at 14, in mid-January 2005, before the basin was widely drilled horizontally as a shale play. It had 52 rigs working in early March.
Most other large domestic basins were up a rig or two, or remained static week to week.
The smaller basins have dropped the most, percentage-wise, in recent months. In the last 10 weeks, the DJ Basin in Colorado has lost 75% of its rigs; while the SCOOP-STACK in Oklahoma has lost 73%.
This week, the DJ was down one rig leaving seven, and the SCOOP-STACK lost three rigs for a total of 11. Even the Eagle Ford, a large oil and gas basin in South Texas, is down nearly 71% in the same time frame. This week, 23 rigs are active in that basin, unchanged from the previous week.