Maritime & Shipping, Crude Oil, Wet Freight
August 21, 2026
Australian Aframax PDA costs rise in H1 2026; trade declines
By Mannat Dora and Palkin Sharma
Editor:
HIGHLIGHTS
PDA costs increase across Brisbane, Geelong, Melbourne and Port Botany
Largest cost components were towage, navigation services, pilotage charges
Aframax trade volumes across four Australian ports fell 22% on year in H1 2026
Australian Aframax trade activity weakened in the first half of 2026, while port disbursement account (PDA) costs for Aframax tankers rose across major Australian ports. Platts Base Rates compare PDA costs at Brisbane, Geelong, Melbourne and Port Botany in H1 2026 against H1 2025.
Among the four assessed Australian ports, Geelong recorded the highest PDA cost in H1 2026 at $167,511, making it approximately 13% higher than Port Botany's $149,634, 59% above Melbourne's $105,710, and double Brisbane's $83,569.
Port-specific charges, including maintenance fees, berth hire, towage and pilotage, accounted for a significant share of Geelong's PDA costs in H1 2026. However, Geelong's trade volumes in H1 2026 stood at 2.48 million mt, down 21.8% from 3.17 million mt in H1 2025.
PDA analysis also showed that Melbourne recorded the highest year-on-year increase in port costs at 22%, primarily driven by higher Australian Quarantine and Inspection Service (AQIS) fees, towage expenses, mooring and unmooring charges, and port security fees. However, trade volumes in H1 2026 stood at 0.91 million mt, down 12.5% from 1.04 million mt in H1 2025.
Port Botany's PDA costs increased nearly 12% year-on-year due to rises in Radio Pratique/AQIS fees, tonnage dues, harbor pilotage and navigation services. H1 2026 trade volumes stood at 2.15 million mt, down 34.5% from 3.28 million mt in H1 2025.
The trend was somewhat different in Brisbane, where declines in mooring and unmooring charges and port security fees helped offset increases in other cost components. Nevertheless, Brisbane's PDA costs rose to $83,569 in H1 2026 from $74,604.80 in H1 2025, while trade volumes fell to 3.12 million mt from 3.62 million mt over the same period.
Across all four ports, government levies, including the Marine Navigation Levy and Oil Pollution Levy, remained unchanged.
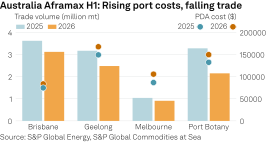
Combined trade volumes at the four ports fell 22.0% year on year to 8.66 million mt in H12026 from 11.10 million mt in the first half of 2025, according to S&P Global Commodities at Sea data.
Thus, higher trade volumes do not necessarily translate into higher port costs, while elevated port costs do not automatically indicate stronger trade activity. Instead, port charges appear to be influenced largely by local tariff structures, port-specific cost components and operational efficiencies.
Aframax Trends: 2024, 2025 and 2026 so far
Combined trade volumes more than doubled to 19.6 million mt in 2025 from 9.1 million mt in 2024. However, the strong growth recorded in the first half of 2025 was not sustained in the first half of 2026, with overall Aframax trade volumes across the four Australian ports declining year on year.
Platts Base Rates data indicated that Aframax PDA costs across the four ports were broadly stable in 2025 compared to a year ago in 2024 despite a significant increase in cargo activity.
Platts is part of S&P Global Energy.
