Electric Power, Energy Transition, Renewables
July 28, 2026
SPP sets all-time peakload record of 58.127 GW as hot weather alerts persist

By Kassia Micek
Editor:
HIGHLIGHTS
North Hub off-peak LMP reached 6-month high
Temperatures averaged 89.09 F, highest since 2023
The Southwest Power Pool's East Balancing Area authority set an all-time peakload record of 58.127 GW on July 27 as the SPP region was under multiple weather-related alerts due to high loads, forecast uncertainty, and severe hot weather.
The record was reached at 4:47 pm CT, SPP spokesperson Seth Blomeley said July 28. The record surpassed the previous record set Aug. 21, 2023, by 369 MW, according to SPP data. However, the actual peakload came in below forecast levels. SPP forecast peakload could have reached 58.53 GW on July 27.
"The SPP East grid continues to perform well as electricity demand reached a new all-time high this week, supported by the growth in solar generation," Mike Pickens, research and analysis associate director at S&P Global Energy CERA, said July 28. "Solar generation exceeded 2.1 GW during the recent peak hour, up from 130 MW when the region last set a peak demand record in August 2023. The grid will continue to be tested through the remainder of the summer season as temperatures rise and power plants operate for longer periods to meet higher electricity demand."
Blomeley said there were no significant issues or concerns during the load peak.
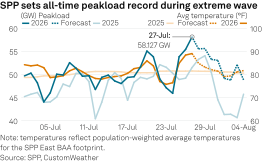
Population-weighted average temperatures across the SPP footprint reached 89.09 F July 27, 9.3% higher than the historical average and the highest daily average temperature since Aug. 24, 2023, according to CustomWeather data. For comparison, temperatures averaged 81.13 F July 1-26 and are forecast in the low to mid-80s F through the rest of the week and in the upper 70s over the weekend.
As temperatures were forecast to ease, so was peakload. SPP forecast peakload at 55.556 GW July 28, 55.629 GW July 29, 53.285 GW July 30 and 53.066 GW July 31, before dipping below 50 GW over the weekend when there less load is on the system.
Grid notices
Parts of the SPP footprint are under multiple weather alerts by the US National Weather Service, including an extreme heat warning, heat advisory, and hazardous weather outlook. Heat index values up to 112 F are expected, according to the weather service.
Real-time prices around 4:20 pm July 28 were above $550/MWh at SPP North Hub, near $140/MWh at SPP South Hub and about minus $56/MWh at SPP West Hub, according to SPP's price contour map. In comparison, the South Hub on-peak day-ahead LMP for July 28 was $46.71/MWh, while North Hub was $89.02/MWh, a day-over-day drop of 3.2% and 23%, respectively.
SPP's West Balancing Authority Area remains under a conservative operations advisory through midnight Aug. 1 based on forecasts of potential high peak loads due to widespread high temperatures, potential increase in resource outages and potential low output from wind and other variable energy resources leading into peak hours, the grid operators said late July 24.
In addition, SPP's East BAA is under a resource advisory through 7 pm July 30 due to high loads, forecast uncertainty, and severe hot weather.
