
PRODUCTS & SOLUTIONS
Energy Studio Impact
Turn big data into real-time energy analytics for faster decisions across the energy value chain.
Overview
Energy Studio Impact is a web-based platform that transforms big data into real-time energy analytics across the entire energy value chain at the speed of curiosity.
It covers upstream, midstream, emissions, and commodity pricing datasets with Platts market-based forward curves. The platform helps geoscientists, engineers, asset managers, and financial analysts to make commercial decisions faster.
Who Benefits from Energy Analytics?
-
Engineers and Geoscientists
We cut down the time spent prepping data to allow users to focus only on the best-performing assets.
- Review type curve analysis for every producing well in North America quickly and at scale
How much of your day is spent generating type curve analysis? It takes weeks to clean and normalize oil and gas data. By the time it is ready for analysis, it is outdated. We assist oil and gas technical teams in saving time spent on a long list of preparation tasks, allowing them to focus solely on the best-performing assets. IMPACT has type curve analysis for every producing well in North America and enables technical teams to access analytics-ready oil and gas data quicker and with fewer resources. - Quickly and accurately predict your asset’s future production
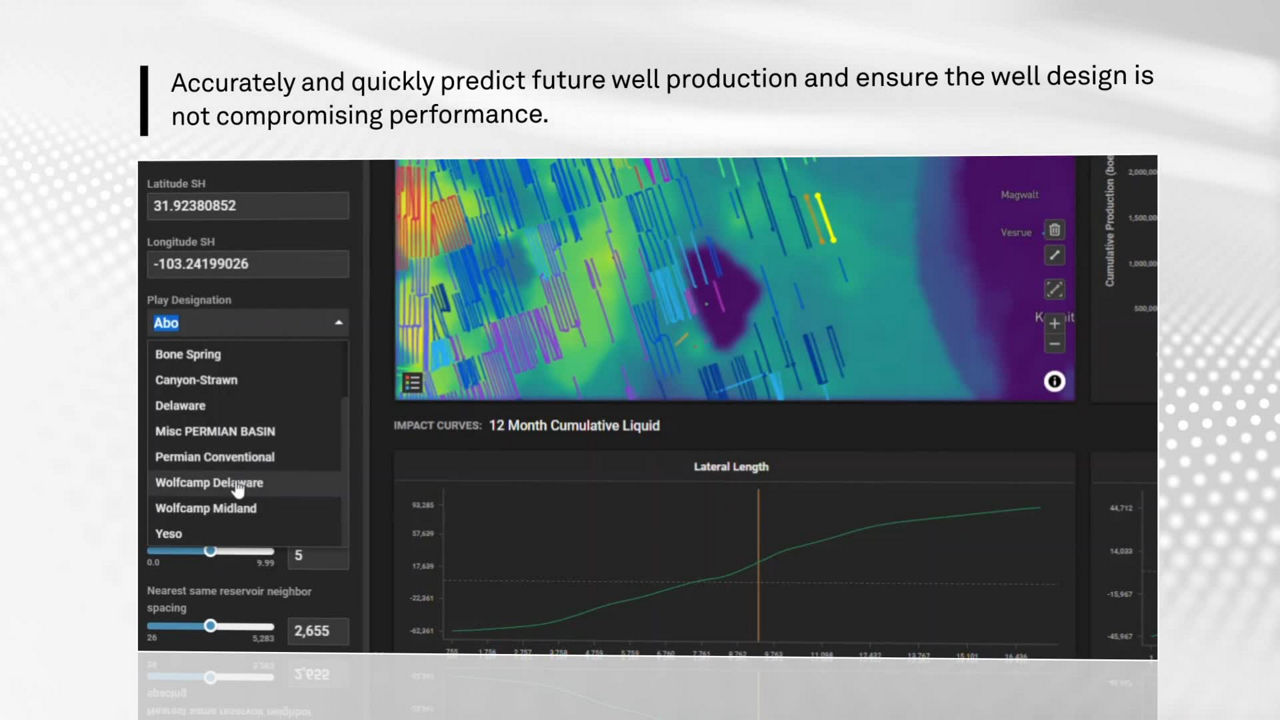
Do you know how a well’s drilling and completions design will influence oil production? With IMPACT, you can model oil production over a range of designs, without ever drilling the well. Visualize and test design parameters like lateral length, proppant volume, and well spacing to see how each one impacts oil well productivity. You can adjust the parameters for a single well or a group of wells and determine the best scenario for optimal oil production, for every basin in North America. - Easily identify underperforming oil wells that can be improved with recompletions
Underperforming wells - every asset has them. Many underperforming oil wells can be improved by recompletions. With oil production and well completion data for every basin in North America, you can quickly identify underperforming oil wells and develop a strategy to increase asset performance. The energy analytics platform allows oil and gas technical teams to evaluate drilling and completions designs and determine if the culprit is geology or engineering. Predictive modeling lets teams model how recompletions will impact existing wells before doing the work.
- Review type curve analysis for every producing well in North America quickly and at scale
-
Strategy & Business Development
We support oil and gas executives and strategists in making the best commercial decisions.
- Benchmark assets against your peers to determine how your strategy is working
Measuring company performance is important, whether it’s your own company, a competitor, or a potential mergers and acquisitions (M&A) target. With IMPACT’s vast data library and customizable dashboards, it’s easy to track every aspect of a company’s performance, from CAPEX to completions. You can do side-by-side comparisons to see how your company is performing relative to peers or competitors, and benchmark M&A candidates. With these insights, you can make better decisions about acquisition candidates, and see which strategies are—or aren’t—working for your competitors. - Make smarter M&A decisions faster
Are you resource-constrained? Do you feel pressured to decide between a quick analysis or a thorough analysis for M&A candidate screening? With IMPACT, you can quickly cut the noise out and focus on prospects that are promising. The platform’s analytics-ready oil and gas data makes it easy to screen and prioritize M&A targets for every highest-producing oil well in North America, so you and your team spend time analyzing only the high-quality assets. - Tracking energy metrics made easy
Are you looking for an easy way to track the energy metrics that matter to your company? IMPACT has data from the entire energy value chain on a single platform, so you can analyze and compare multiple KPIs across companies. Use these KPIs to identify promising M&A targets, compare company performance side-by-side, and determine which assets are the best to acquire or divest.
- Benchmark assets against your peers to determine how your strategy is working
-
Financial Capital Markets
We fill technical gaps for investors and make oil and gas data transparent, comprehensive, and easy for screening investment opportunities.
- Quickly short-list investment opportunities with a high ROI
Comparing oil and gas companies to their peers is one way to determine if it is a good investment or not. For oil and gas companies, benchmarking companies of similar size and similar acreage holdings is the best approach. With access to oil and gas data from all operating companies in North America, your analysts can perform an unbiased comparable company analysis without relying on the seller to provide data. - Energy industry trends, unlocked
Do you know which operators have the lowest breakeven? Do you know about historical transactions in the Permian? Do you know where operators are drilling today? Historical and current market trends, like drilling activity, historical transactions, and available assets, are valuable tools in determining a company's fair market value. Oil and gas companies that are outperforming the market likely have a high ROI, while companies that are lagging behind should be avoided. IMPACT’s comprehensive technical and financial datasets show the full picture of a company's valuation, helping decrease risk in investment decision-making. - The new easy way to screen investment candidates
How are you screening your investment candidates? Economic factors, like operating expenses and commodity prices, can make or break a potential purchase. The oil production forecasts from type curves can be used to model future revenue based on CAPEX and oil prices. This data can also be used to calculate breakeven prices—a key factor in determining the economic viability of an operator's assets.
It is important to look at type curves for every oil well, as sellers may be showing only the best data or data from a certain time period. Companies tend to drill the most promising areas first, so initial oil production results may not reflect the company's entire portfolio. IMPACT data helps to analyze type curves from all of an operator's wells and the surrounding area and provides important context when evaluating potential revenue.
- Quickly short-list investment opportunities with a high ROI
What Sets us Apart
-
How to Take the Guesswork out of M&A Screening?
With our Plan and Predict model, you can compare analyses with multiple inputs and adjust parameters to forecast revenue on future oil wells at a variety of commodity prices. Our mergers and acquisitions database includes type curves, peaks, breakevens, and more for every highest-producing oil well in North America, so you can ensure you are paying the right price for a prospect or play. The pre-built oil and gas type curves eliminate the need for decline curve analysis and determining b-factors.
-
How Does the Analytics-Ready Oil and Gas Data Help Industry Players Make Business Decisions Faster?
Eliminate tedious manual calculations with our analytics-ready oil and gas data from every part of the energy value chain. Well spacing, completion trends, type curves, rig count—we have the data, and it is ready to go. Quickly identify the most promising opportunities and focus your work on the right asset.
-
Do you Have the Right Strategy to Drive Oil and Gas Production?
Benchmark your assets against competitors and peers to see how you are performing. The side-by-side comparisons can identify underperforming assets and provide valuable insight into what’s driving production.
-
What is the Methodology Behind Our Accurate Oil Production Forecasting?
The energy analytics platform has type curves for every producing well in North America. We used proven screening technology from Harmony and artificial intelligence to partition wells and produce hyperbolic parameters that lead to accurate oil production forecasting. And you can test future production outcomes based on a variety of well designs and parameters.
-
How can we Help you to Improve Your Oil And Gas Asset Performance?
With production and completion data for every basin in North America, you can quickly identify underperforming wells and develop a strategy to increase asset performance. Evaluate their drilling and completions designs to determine if the culprit is geology or engineering. Analyze well completion trends across the basin and decide which wells are candidates for recompletions.
-
How to Immediately Assign Value to Future Oil and Gas Production?
In a market environment that generates plenty of uncertainties, our Platts Forward Curves offer an independent, verifiable source to help validate models and asset valuations, project future revenues and expenses, and better align risk tolerance with business strategy. Platts Forward Curves help you to immediately assign value to future production and assess the economic impact of underperforming wells over time.
Key Features
- Powered to consume trillions of rows of data without the need for refining the data set
- Library of 6+ million oil wells (or every well in North America), including type curves, estimated Capex, nearest-neighbor spacing, D&C design, and breakeven prices
- Forecasts of 1+ million ACTIVE oil wells in seconds. Pre-calculated well-level monthly forecasts that can be aggregated to any level
- More than 4200+ machine learning models are utilized to predict oil, gas and water production for existing and hypothetical wells
- Over 750 Platts Forward Curves covering oil, refined products, LNG, natural gas, power, NGL and energy transition. Learn more about Platts Forward Curve on Energy Studio Impact
- Greenhouse gas emissions (CO2, CH4 and N2O) monthly estimates for the 6+ million wells in US and Canada (drilling & completion diesel combustion, well test and natural gas flaring, mud degassing, venting, fugitives, well-site power production, grid power consumption). Learn more about Upstream Enhanced Emissions on Energy Studio Impact
- 350+ attributes in the well and production table for all North American wells, including 120 spacing attributes
- 20+ datasets
- 10+ dashboards for the base subscription
- Unlimited charts, tabs, and dashboard creation
- Full history of data (all time), back to the Drake well in 1859
Data & Distribution
Get the edge in today’s global markets with our Essential Intelligence® delivered through the providers and platforms which suit you.
API Solutions
Cloud
Data Feed
Desktop & Mobile
Why Upstream Solutions?

Unparalleled Experience
For decades, we've monitored the global energy sector, using expert insights, software, and proprietary data to help you assess value, manage risk, and seize opportunities to achieve success.

Global Intelligence
With coverage of over 200 countries and territories, we offer data that is not only comprehensive but also global in scope, supporting your international and regional projects.

Independent Source
Our independent expertise allows us to provide unbiased, industry-specific guidance that helps our clients navigate complex market dynamics.

Data Your Way
Gain access to upstream data and insights delivered when and how you need it. From the established to the cutting edge – all via multiple platforms that can give you a decisive edge over the competition.

Upstream Experts
Partnering to help you achieve a successful future, our global team of upstream experts offers extensive knowledge across the entire Energy Value Chain.

AI-Driven Technology
We leverage advanced AI/ML technologies—from geological datasets to E&P software and analytics, to asset transaction value research—enabling AI-driven efficiencies for smarter, faster decision-making in the upstream energy industry.
Contact Sales
Interested in this product?
Complete the form and a team member will reach out to discuss how our solutions can support you.