


30 Dec 2019 | 16:14 UTC — Insight Blog
Commodities and energy in 2019, in infographics

Featuring S&P Global Platts
In a volatile year for commodities and energy, S&P Global Platts' news, pricing and analytics teams explored many of the biggest themes and trends through infographics. Here are a selection.
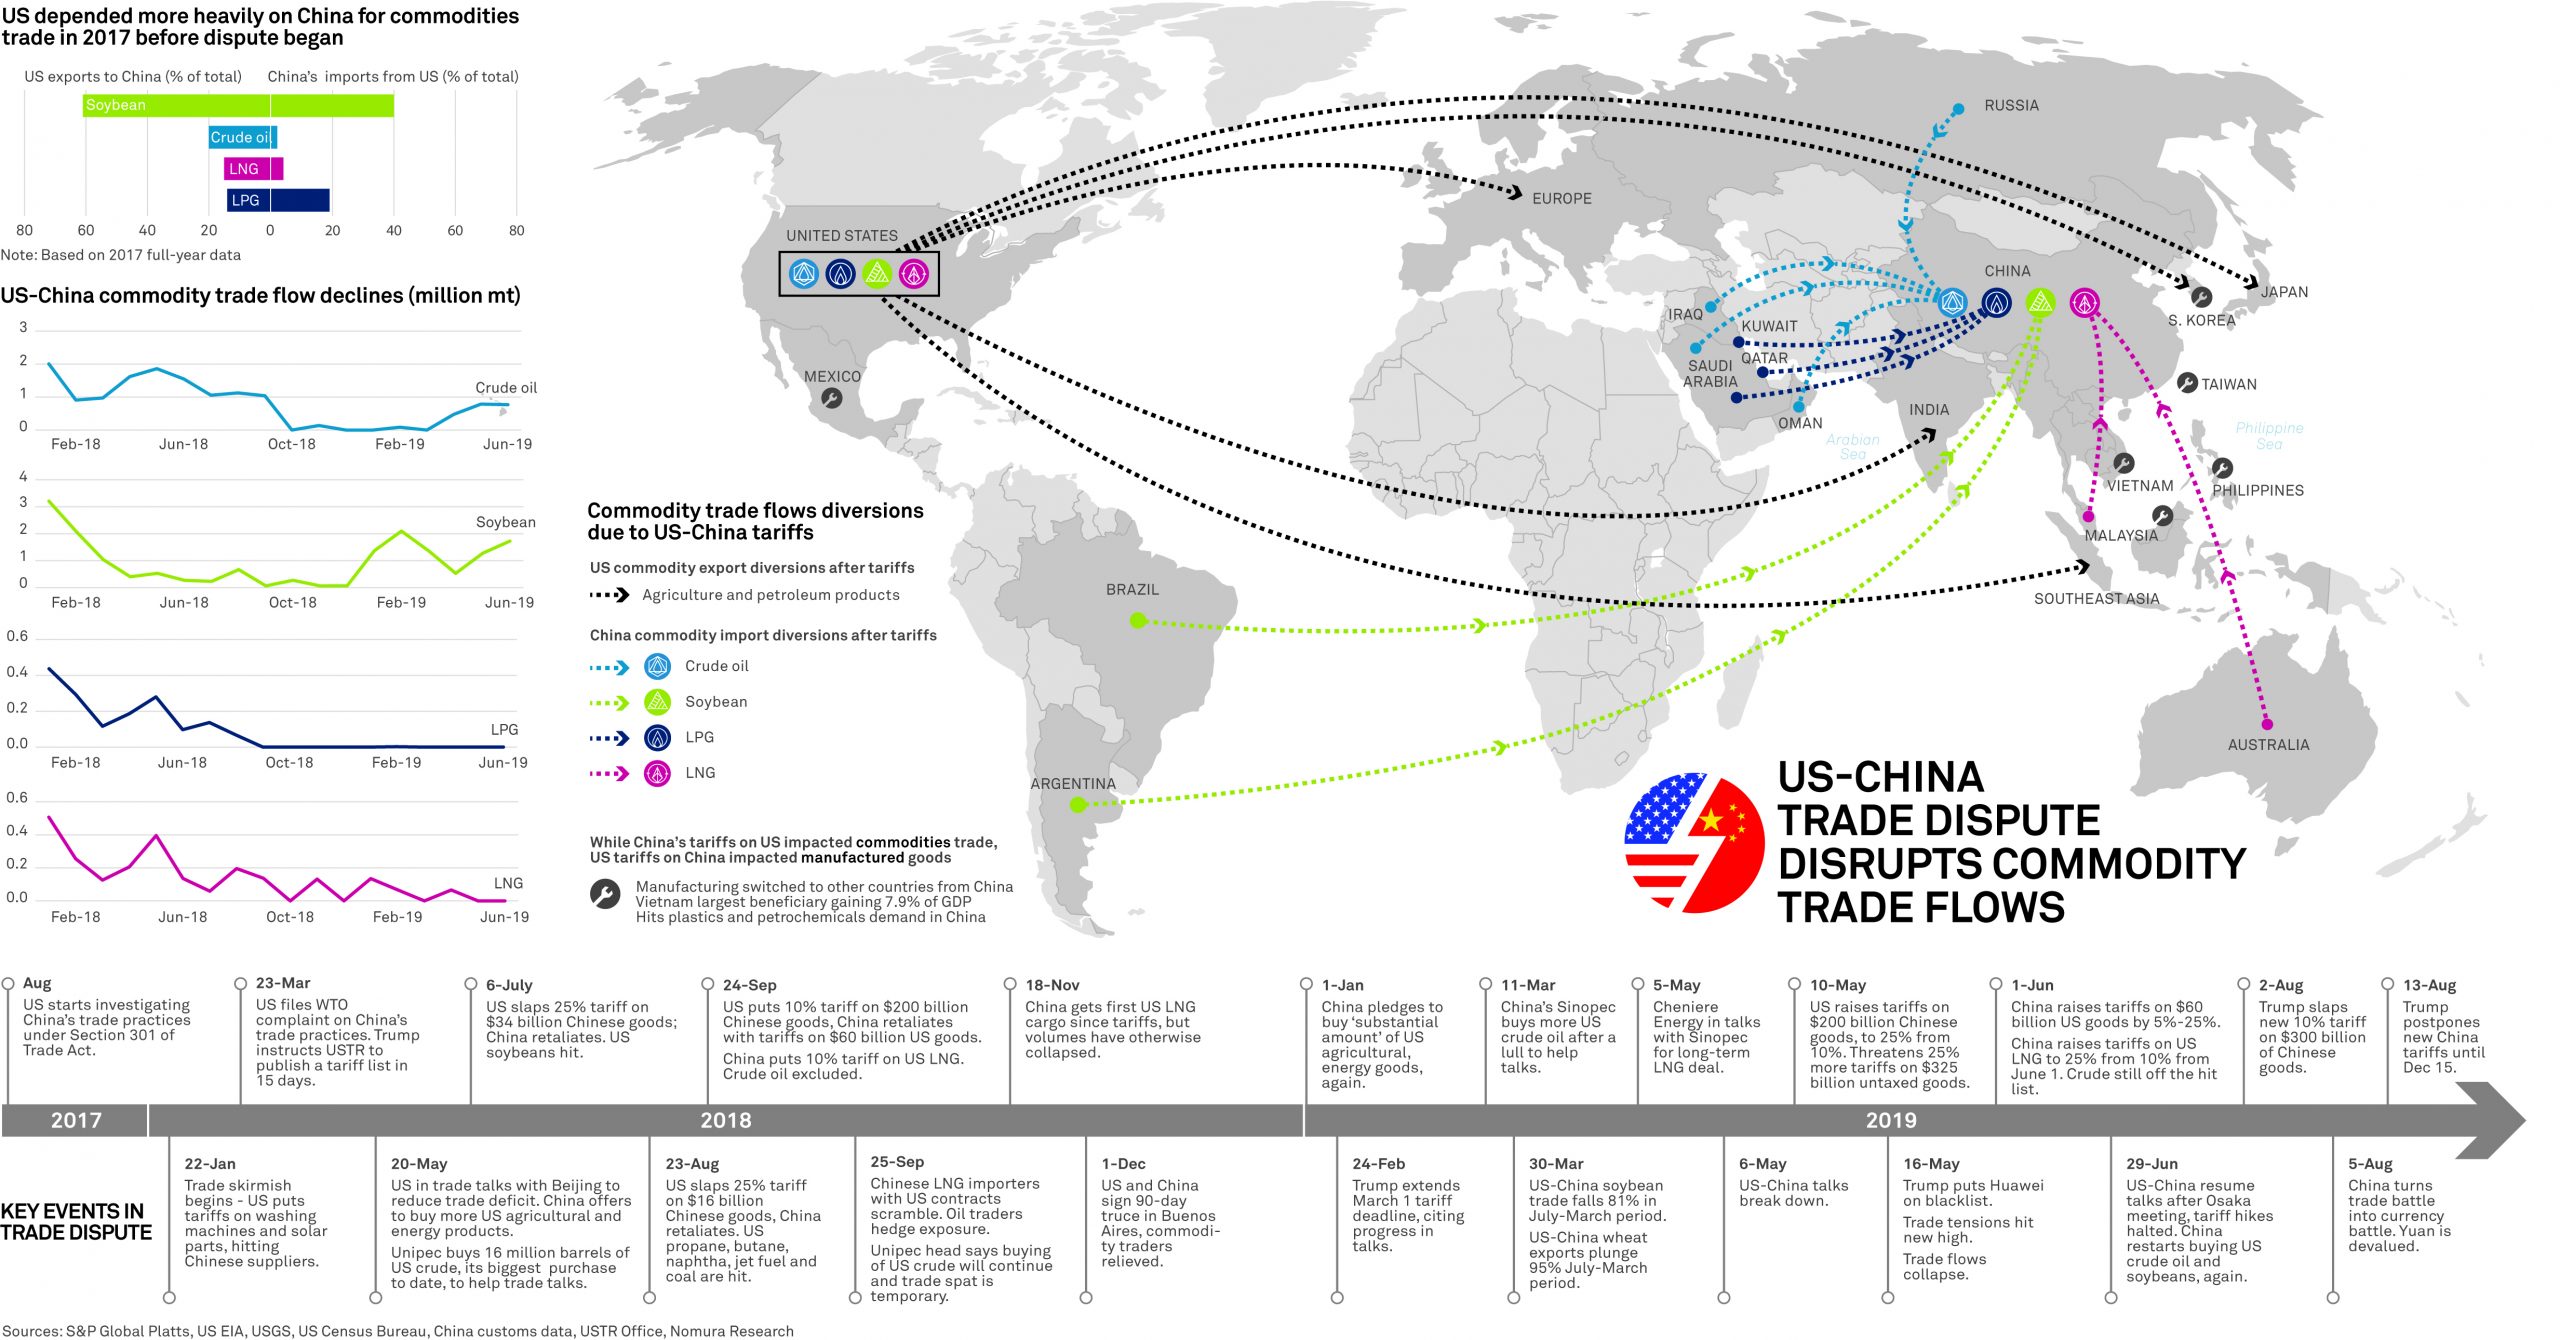
Tariff disputes weigh on commodities trade
After around two years of
trade tensionsbetween the US and China, S&P Global Platts analyzed the impact on global product flows.
Click for full-size infographic
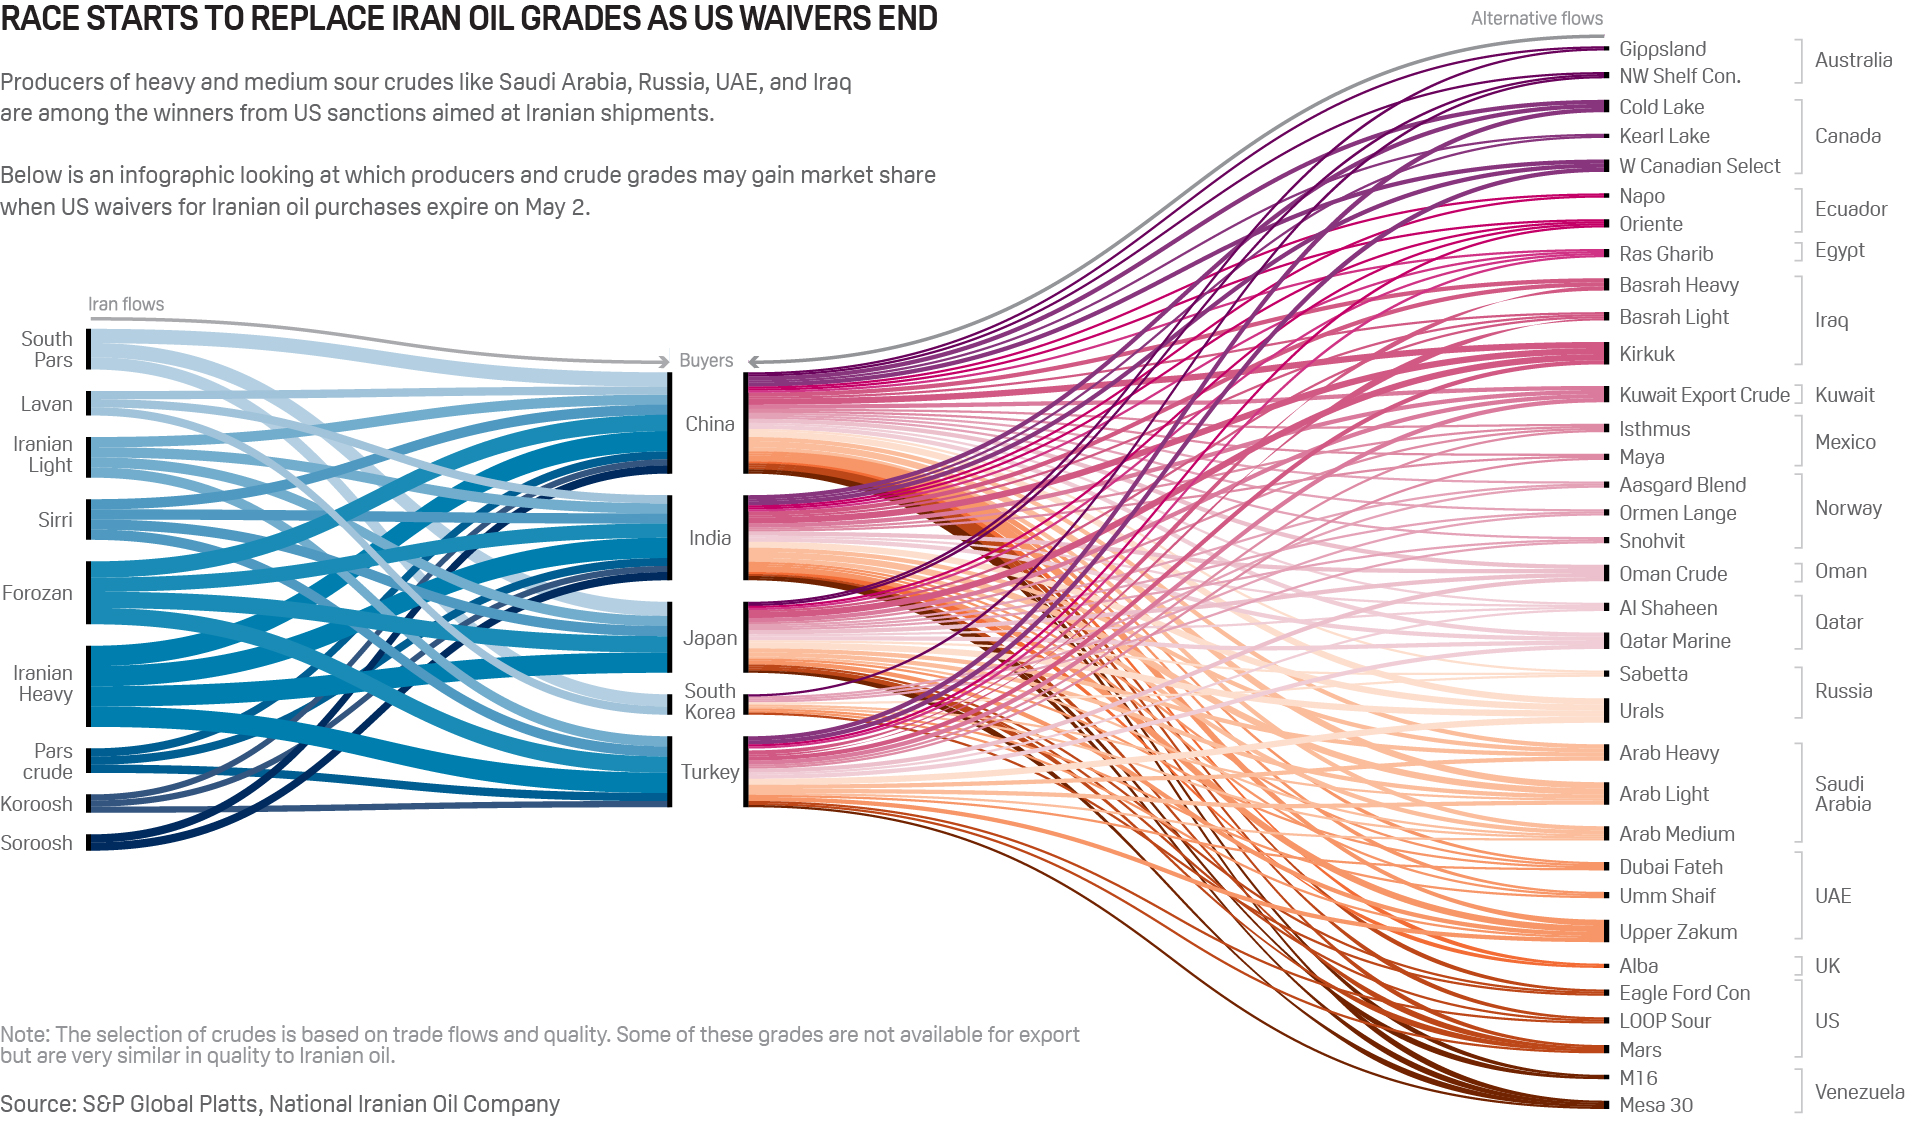
How to replace Iranian oil?
After US sanctions on Iran tightened with the non-renewal of waivers for oil importers, there were still plenty of options on the table to replace specific Iranian crude grades.
Click for full-size infographic
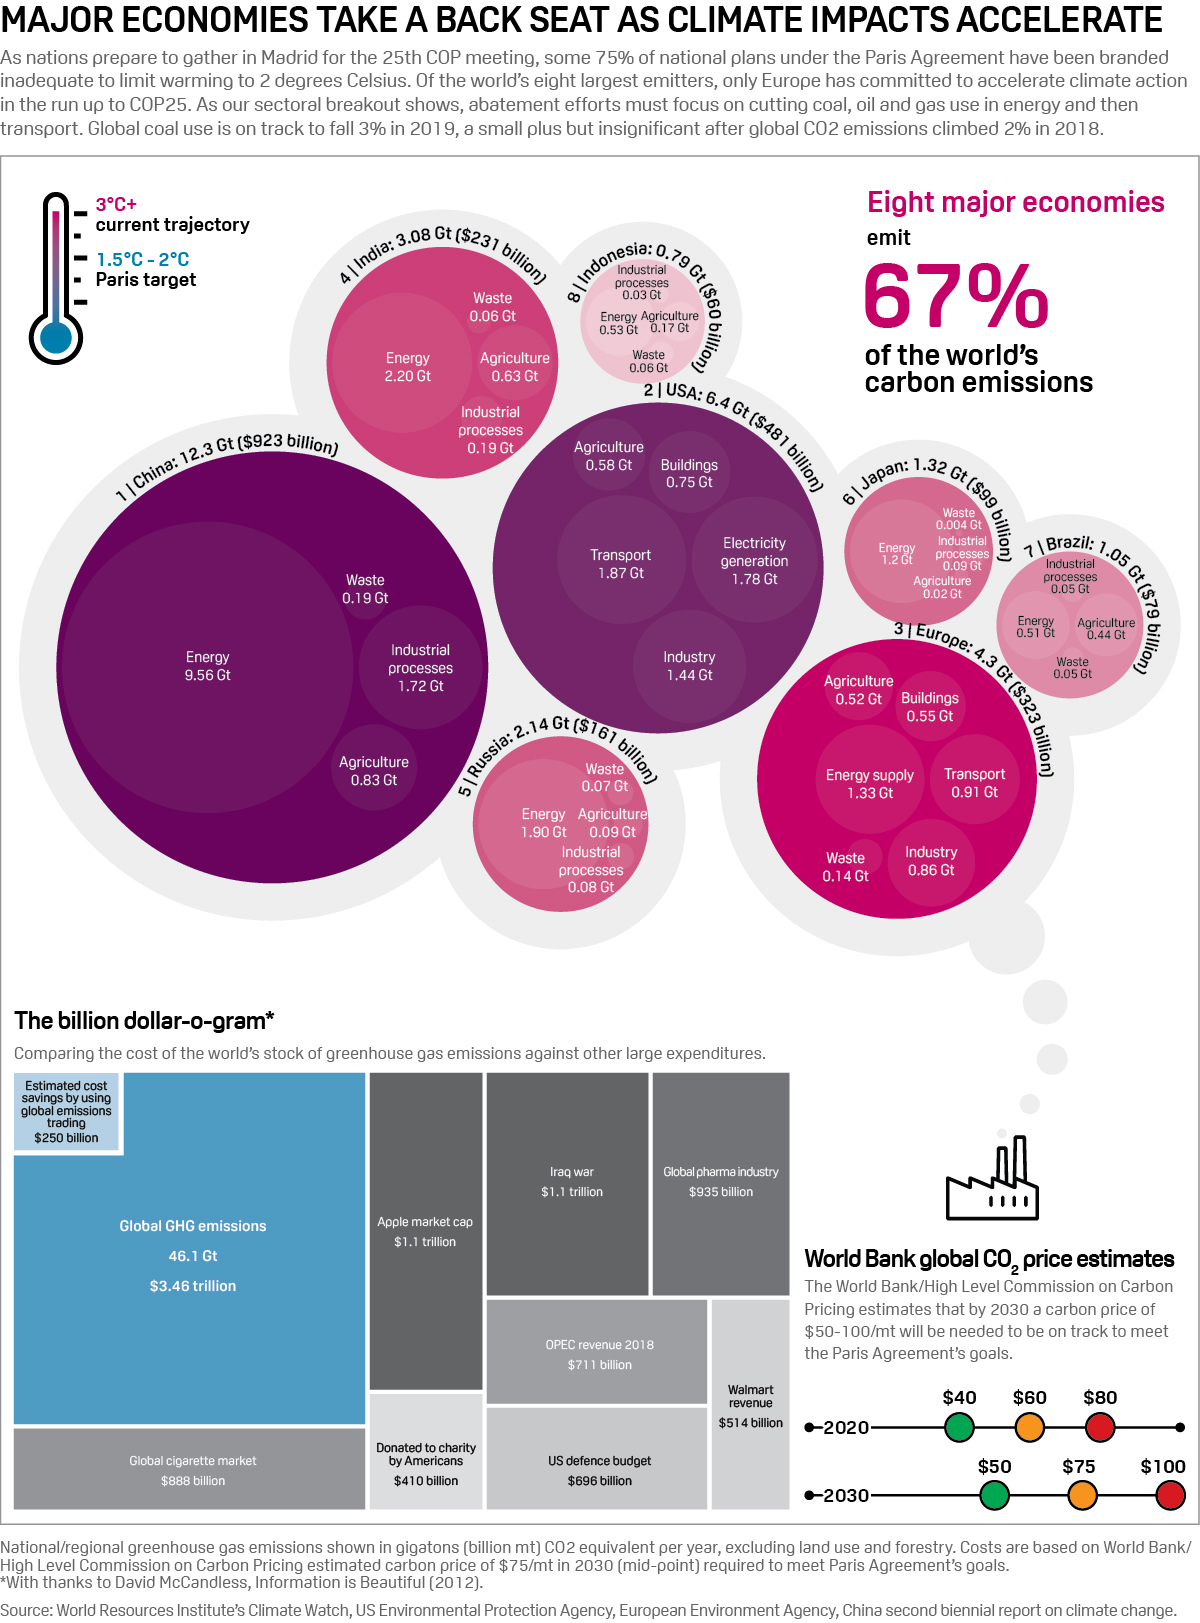
The biggest carbon emitters
Ahead of COP 25 in Madrid, S&P Global Platts crunched the numbers to show carbon emissions of the biggest global economies, and their costs compared to other major expenditures.
Click for full-size infographic
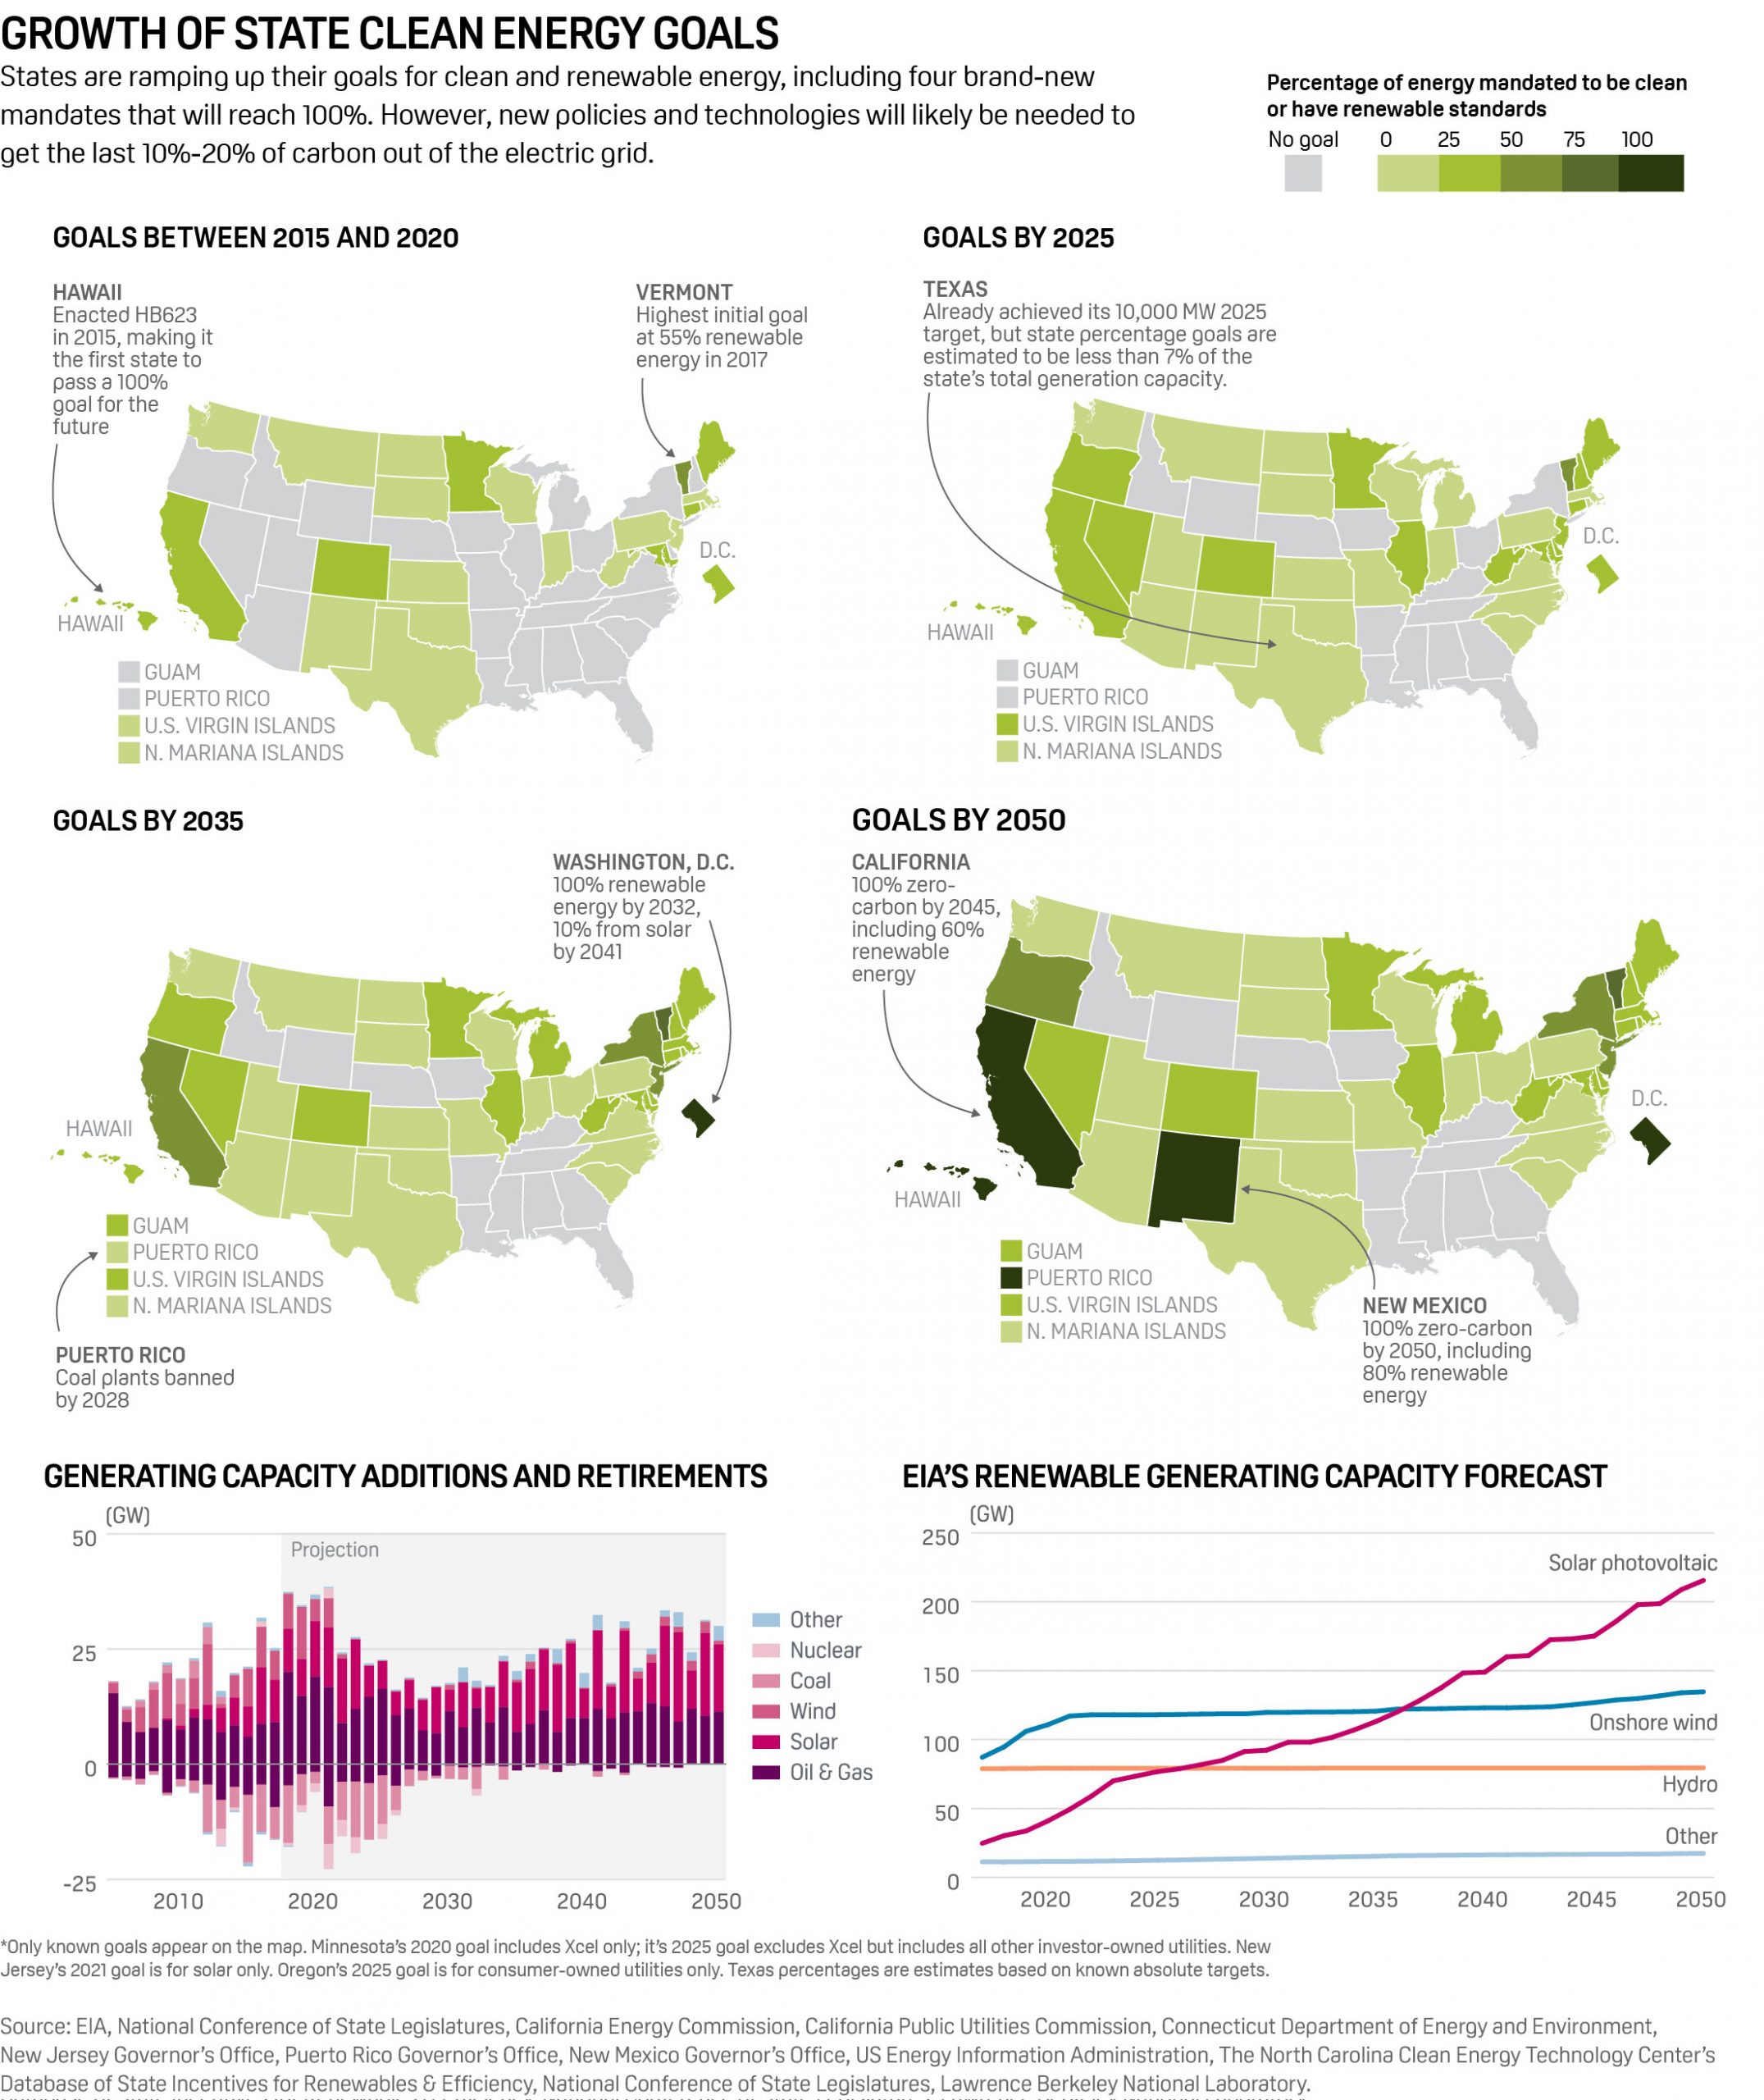
US states ramp up clean energy goals
President Trump may have disengaged from global efforts to tackle climate change, but individual US states are still pushing ahead with ambitious targets to ramp up renewables.
Click for full-size infographic
Middle East oil supply vulnerability
The succession of attacks on Middle Eastern oil infrastructure had a short-lived effect on crude oil prices, but was a reminder of how exposed a large portion of the world’s supply really is.
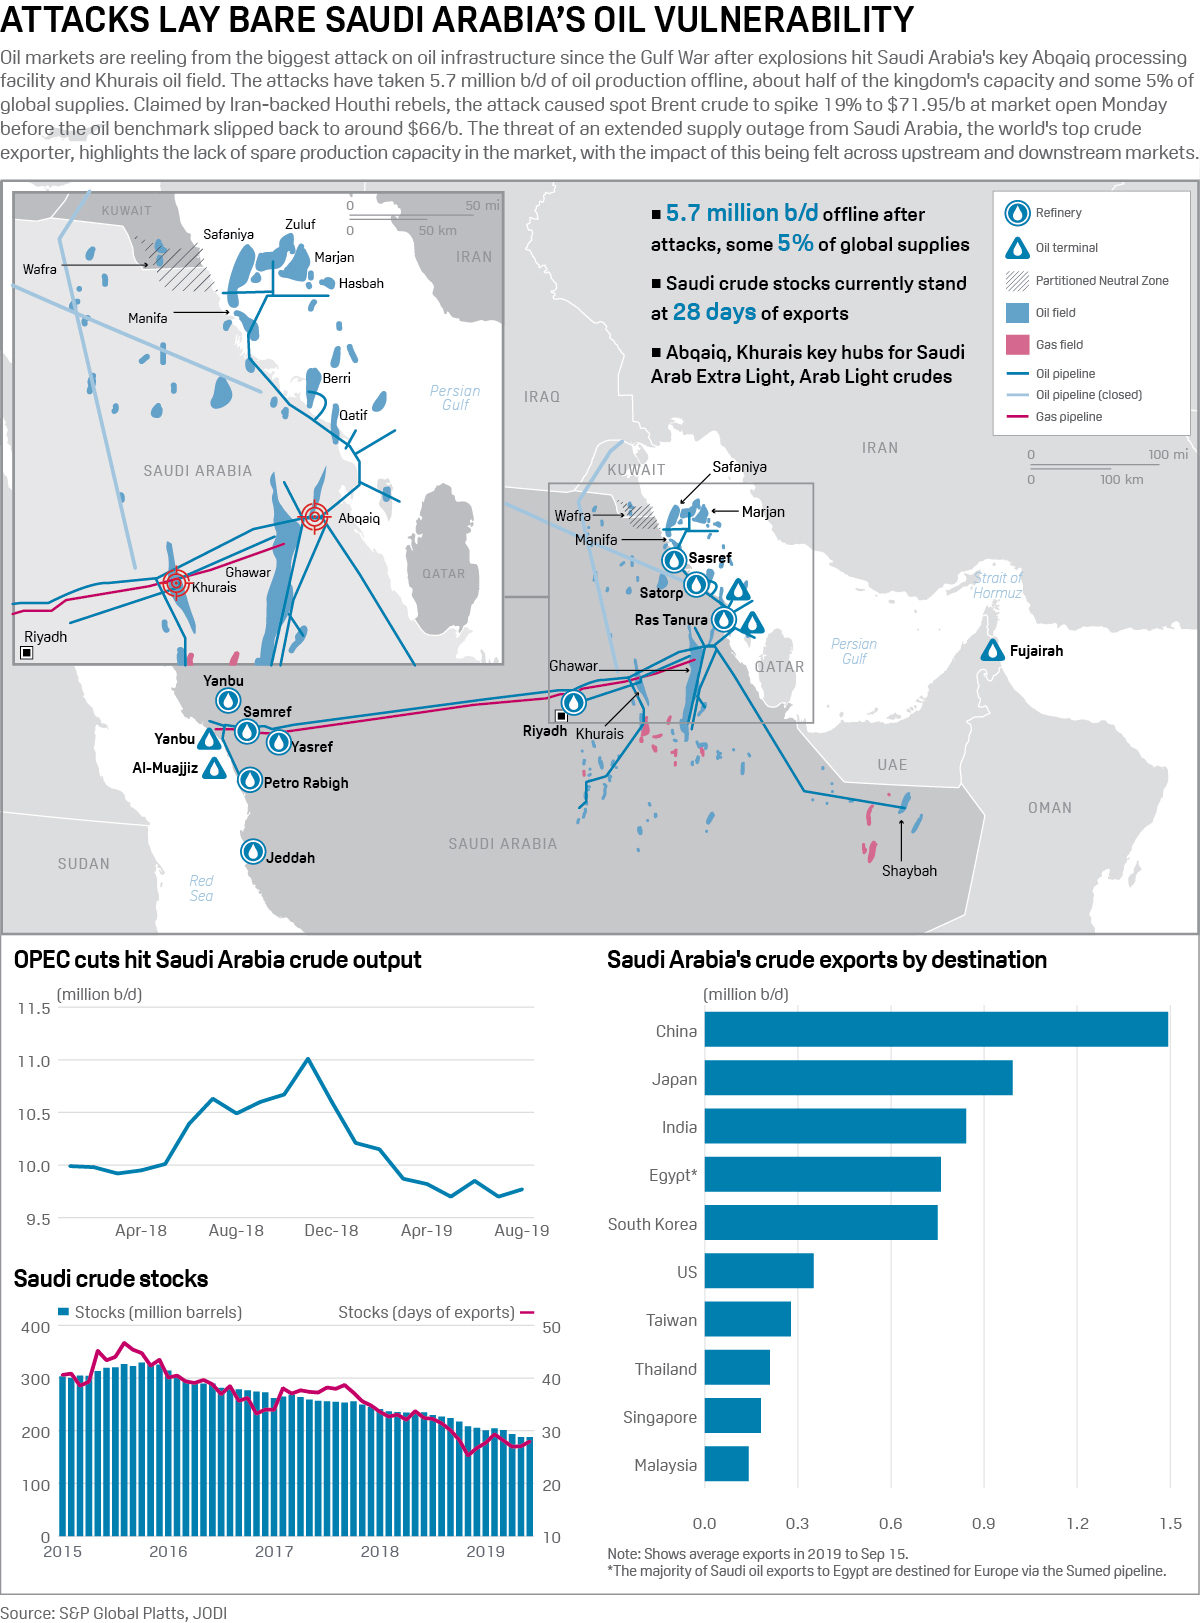
Click for full-size infographic
Go deeper: Podcast - Sizing up geopolitical risks to oil in 2020
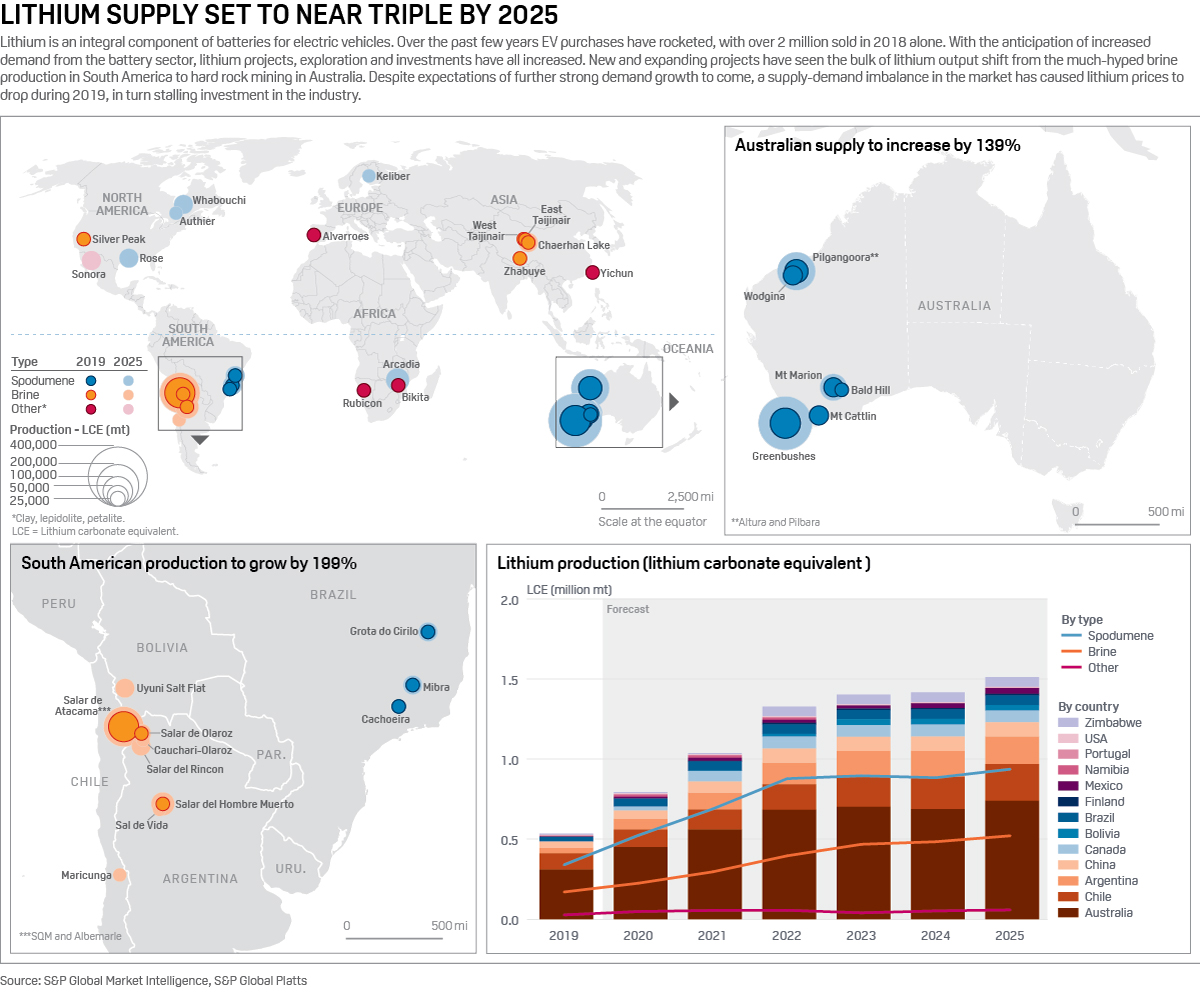
Lithium supply in the age of EVs
Amid tumbling prices, can
lithium supplykeep up with demand going into the next decade? S&P Global Platts looked at global production hotspots and market fundamentals.
Click for full-size infographic
East Med a burgeoning gas supply hub
New discoveries this year elevated the East Mediterranean’s position as a gas supplier. Egypt has begun exporting LNG again, and hopes also to capitalize on rising
Israeli gas production.

Click for full-size infographic