


14 Oct 2020 | 22:26 UTC — Houston
ANALYSIS: Cal-ISO returns to top renewables producer in Q3, but US total slips from Q2

By Kassia Micek
Highlights
Cal-ISO returns to top renewable producer at 238 GWh/d
SPP renewables down 13.9 percentage points from Q2
Cal-ISO renewables down 7.9 percentage points YOY
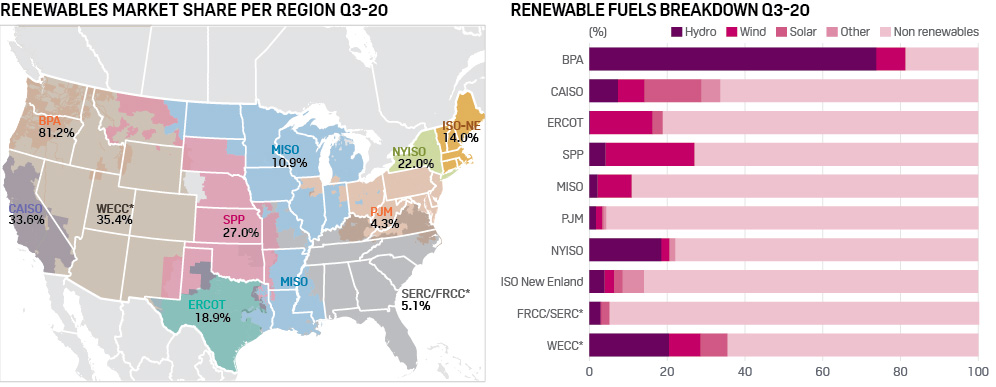
Wind and solar generation output mostly increased year on year across the US for third quarter 2020, while total renewables accounted for less market share quarter on quarter as thermal generation increased to serve load during the summer peak season.
Click here for full-size image
"There are seasonal patterns in hydro and wind that would contribute to a quarterly decline," said Morris Greenberg, S&P Global Platts senior manager of North American power analytics. "It's actually lower renewables output, along with higher loads, that drives increased thermal generation."
The Bonneville Power Administration continues to have the largest market share of total renewables at 81.2% of its fuel mix, up 6.3 percentage points year on year, according to BPA data. The California Independent System Operator became the top renewable producer across the US, averaging 238 GWh/d, despite a drop of 17.7% year on year, according to Cal-ISO data.
Wind generation
The Electric Reliability Council of Texas had the most wind output at nearly 202 GWh/d, up 1% year on year for Q3, but the Midcontinent Independent System Operator had the biggest increase in wind output, up 35% year on year, according to ERCOT and MISO data, respectively.
However, Southwest Power Pool led in wind market share at almost 23% of its total fuel mix, according to SPP data. SPP set a wind generation peak record of 18.343 GW on July 17.
SPP President and CEO Barbara Sugg expects wind to be the lead fuel source this year. There has been nearly 750 MW of wind capacity added in SPP year to date, with another almost 5.3 GW in the generation interconnection queue listed as "on schedule" with commercial dates proposed this year, according to SPP data.
ERCOT's wind capacity has increased 4.7% year on year to nearly 25 GW and the grid operator could add up to an additional 5.9 GW this year, according to ERCOT's latest capacity change report that includes data through September 2020.
Solar generation
The Western Electricity Coordinating Council region had the most solar output at about 150 GWh/d, down 1.4% year on year, while Cal-ISO had the largest market share at 14.5% of its total fuel mix, despite down 3 percentage points quarter on quarter, according to Plats Analytics and Cal-ISO data, respectively.
However, ERCOT solar output climbed 112% year on year in Q3, according to ERCOT data. ERCOT's solar capacity has risen 5.9% year on year to 3.6 GW and the grid operator could add up to an additional 1.5 GW this year, according to ERCOT's latest capacity change report that includes data through September 2020.
With more wind and solar built in West Texas, ERCOT West Hub on-peak day-ahead locational marginal prices were 70% lower year on year in Q3 and 39% lower than the 5-year Q3 average, according to ERCOT data.
In the first two weeks of September, Cal-ISO average solar-powered electricity generation declined nearly 30% from July and was down 13.4% year on year as wildfire smoke particles reduced the amount of sunlight that reached solar panels, according to the US Energy Information Administration. More than 8,500 wildfires have burned over 4.1 million acres in California this year, according to the California Department of Forestry and Fire Protection
Since Q3 2019, Cal-ISO added 1.2 GW of solar, according to Cal-ISO's grid generation queue data. The queue also lists nearly 1.3 GW of solar with completed studies, executed interconnection agreements and 2020 proposed online dates.
Hydro generation
BPA had the largest hydro market share at nearly 74% of its total fuel mix in Q3, up 8 percentage points year on year, and had the biggest increase in hydro output, up 35% year on year, according to BPA data. Cal-ISO had the biggest drop in hydro output, shedding 45% from a year ago, according to Cal-ISO data.
Click here for full-size image
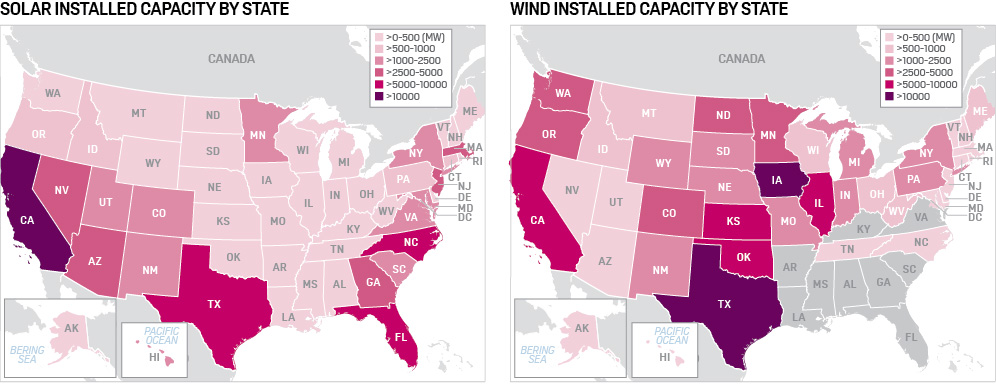
Source: AWEA
Source: SEIA/Wood Mackenzie Power & Renewables
Capacity comparison
Cal-ISO, which manages the flow of electricity for about 80% of California and a small part of Nevada, has more than 24 GW of renewable capacity, according to Cal-ISO data as of Aug. 10.
The state of California ranks No. 1 for installed solar capacity in the US at about 28.5 GW, according to Solar Energy Industries Association and Wood Mackenzie Power & Renewables data through Q2 2020. North Carolina ranks No. 2 at nearly 6.5 GW.
The state of Texas ranks No. 1 for installed wind capacity at about 30.2 GW, according to American Wind Energy Association data through April 2020. Iowa ranks No. 2 at around 10.7 GW. Eleven of the 14 states that are SPP members rank in the top 20 for installed wind capacity.
ERCOT, which manages the flow of electricity for about 90% of Texas, has 28.6 GW of combined wind and solar capacity, according to grid operator data.