


28 May 2020 | 19:20 UTC — Houston
US oil, gas rig count slips 24 week on week to 333 as cycle bottom seen nearing

Highlights
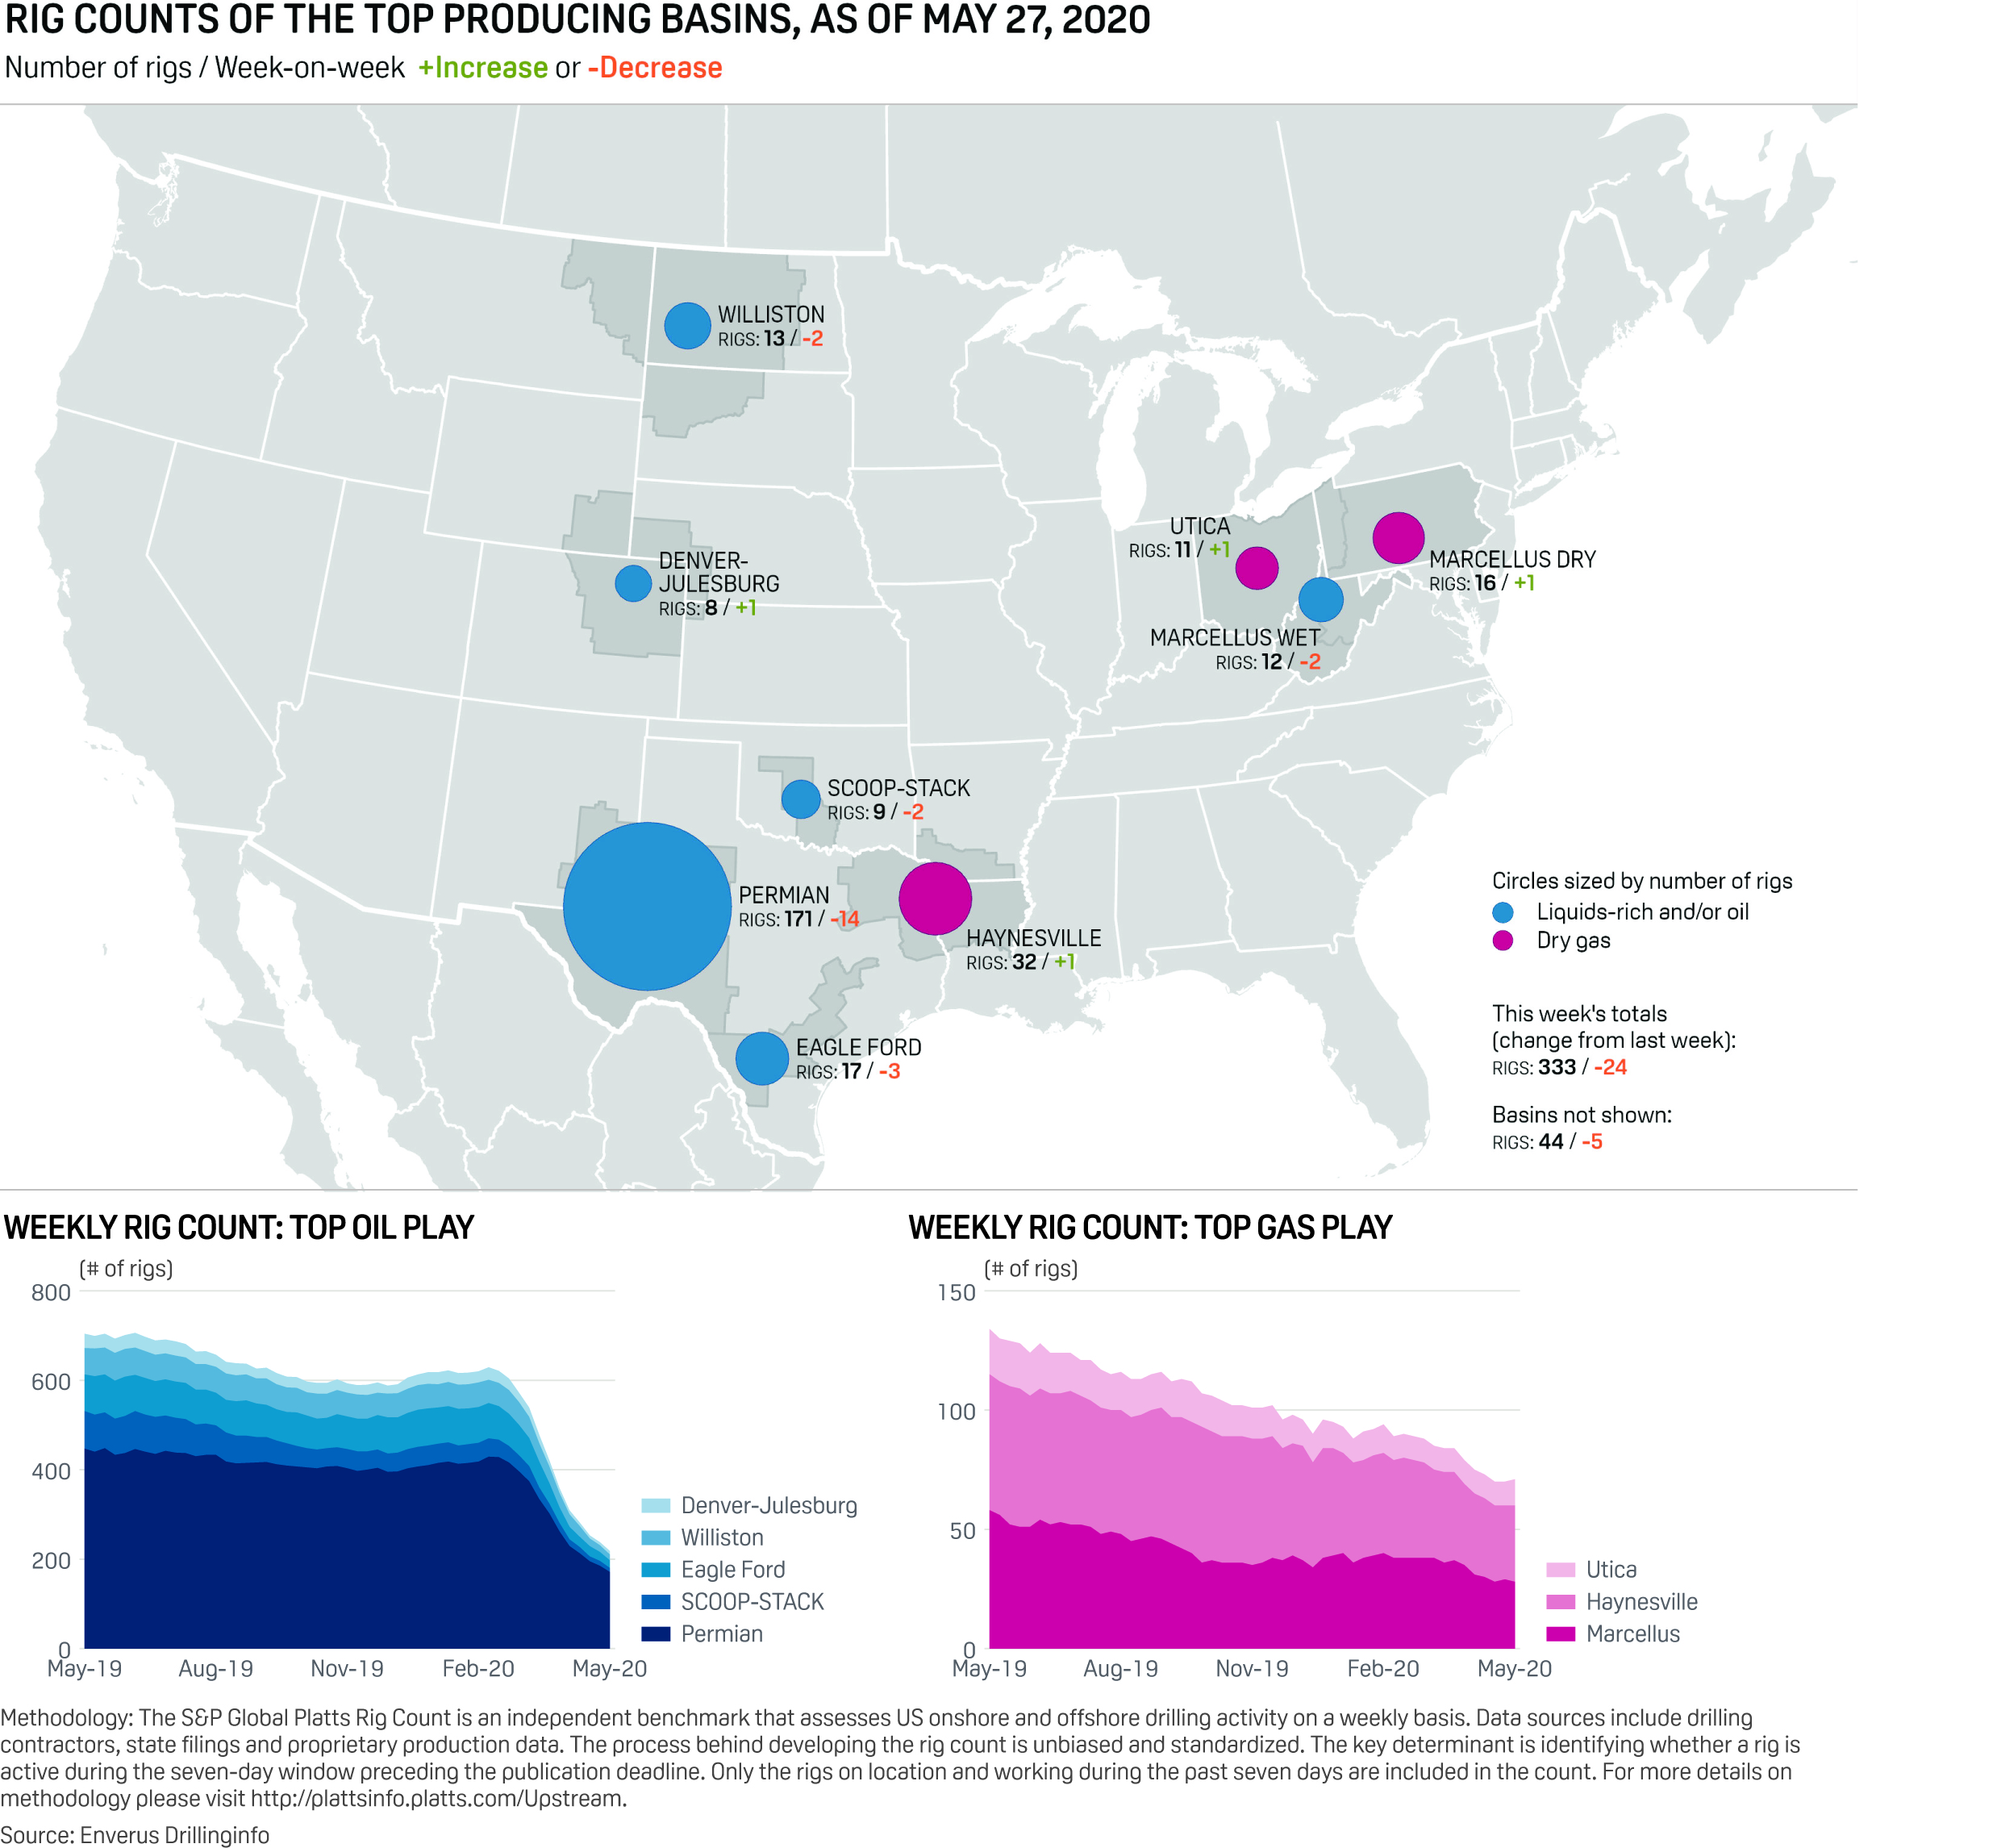
Permian Basin sheds 14 rigs this week to fall to 171
Decline in rig totals slowing
Operators eye more gas drilling in H2 2020
Houston — The US oil and natural gas rig count slipped 24 this week to 333, rig data provider Enverus said Thursday, with the slowing rate of decline suggesting a bottom is near.
Oil rigs, as usual, made up most of the total drop this week, falling 23 to 223. Just one gas rig left fields, leaving 110 operational.
The US rig count has plummeted from 835 in early March, shedding more than 500 rigs in 11 weeks, or 60% of the total.
A week earlier, the rig count fell by 12, and experts believed that indicated a bottom was near. This week's 24-rig decline is larger, but far less than in previous weeks, Matt Andre, an analyst with S&P Global Platts Analytics, noted.
Any one week can simply be "noise," Andre said.
Click here for full-size image

The US rig count fell by 289 in April but that decline has slowed to a loss of 99 rigs in the past four weeks.
"Through March and April, rigs were averaging weekly drops of 57, but in May that has fallen to only 25 as an average week-on-week rig drop," he said.
"Low to mid-$30s/b isn't going to promote new drilling, but it will slow down curtailments" of production by US oil companies, which now total about 1.7 million b/d, Andre said.
"Rigs will likely continue to drop but at a lower rate, around 15 rigs each week, but we believe it's approaching the floor."
In early March, crude prices plunged from around $46/b to the low $30s/b, with WTI later dropping into the teens, but values has recovered somewhat.
According to Platts Analytics, WTI increased this week to average $33.71/b, up $2.68; WTI Midland averaged $33.89/b, up $2.03; and the Bakken Composite averaged $32.36/b, up $1.08.
Another sign of a potential cycle bottom involves the nature of customer calls, Andy Hendricks, CEO of big North American land driller Patterson-UTI, said in a recent webinar sponsored by Evercore ISI.
Early in the downturn, upstream customers were looking to slow down drilling and cancel rigs, Hendricks said, but those types of calls are less frequent now.
"Our customers have slowed down those calls, which we take as a positive sign," he said. "I don't know if we're at the bottom yet [for] activity and the rig count, but we must be getting closer. We aren't having those types of conversations as much as we were" a few months ago.
It usually takes two quarters of activity to gauge when an industry trough occurred in hindsight, Kevin Neveu, CEO of Precision Drilling, said in a separate recent webinar with Evercore ISI.
But "I think it will be hard to call a bottom until it's well in our taillights," Neveu said. "[But] I'd be surprised if the wind-down takes longer than the second quarter."
PERMIAN RIG TOTALS DROP AGAIN
Rig counts in US domestic basins are at levels not seen in years or decades. The Permian Basin of West Texas/New Mexico, which has been the most active domestic play and was running nearly 500 rigs in early 2019, this week saw a decrease of 14 rigs to 171.
Since early March, the Permian's rig count has plummeted 60.1%, falling by 258 rigs from 429.
The count for the Eagle Ford Shale in South Texas fell by three rigs this week to 17, while the Bakken Shale in North Dakota/Montana saw a decline of two rigs to 13. The Bakken had around 200 rigs running at its peak.
Most other US basins were saw little or no change in rig totals.
NEW GAS INTEREST
With the drop in oil prices and the oil rig count, drillers say they have received an increasing number of calls from E&P customers about gas projects later this year--a phenomenon not anticipated nor seen in years.
"The gas market, in certain basins, and I'd include the Haynesville and Eagle Ford in that, prices above $2/Mcf will stimulate some incremental drilling," said Anthony Gallegos, CEO of land driller Independence Contract Drilling, during a recent webinar.
"We need the demand side of the commodity to move up and tighten, and I think that will happen as we see the effects of less associated gas from oil basins and less overall drilling across the country." Gallegos said.
This week, benchmark Henry Hub gas prices were unchanged on week at $1.70/MMBtu, while Dominion South averaged $1.31/MMBtu, up 6 cents.
"I think if we can hold at better than $2/Mcf gas, we may see some demand come back into the market," Gallegos said.
| Oil cutbacks slash into US rig count | ||||||||
| Oil-focused basins | Gas-focused basins | |||||||
| Date | Permian | SCOOP-STACK | Eagle Ford | Williston | Denver-Julesburg | Marcellus | Haynesville | Utica |
| 3/4/2020 | 429 | 41 | 79 | 52 | 28 | 38 | 41 | 10 |
| 3/11/2020 | 428 | 39 | 75 | 52 | 27 | 38 | 42 | 10 |
| 3/18/2020 | 416 | 37 | 72 | 53 | 26 | 38 | 41 | 10 |
| 3/25/2020 | 396 | 36 | 68 | 51 | 21 | 38 | 40 | 10 |
| 4/1/2020 | 374 | 34 | 63 | 47 | 21 | 38 | 37 | 10 |
| 4/8/2020 | 334 | 26 | 58 | 41 | 19 | 36 | 38 | 10 |
| 4/15/2020 | 302 | 22 | 46 | 37 | 14 | 37 | 37 | 10 |
| 4/22/2020 | 262 | 19 | 35 | 32 | 11 | 35 | 34 | 10 |
| 4/29/2020 | 229 | 15 | 28 | 28 | 9 | 31 | 34 | 10 |
| 5/6/2020 | 213 | 14 | 23 | 24 | 8 | 30 | 33 | 10 |
| 5/13/2020 | 195 | 11 | 23 | 17 | 7 | 28 | 32 | 10 |
| 5/20/2020 | 185 | 11 | 20 | 15 | 7 | 29 | 31 | 10 |
| 5/27/2020 | 171 | 9 | 17 | 13 | 8 | 28 | 32 | 11 |
| 12-week change | -258 | -32 | -62 | -39 | -20 | -10 | -9 | 1 |
| -60.10% | -78.00% | -78.50% | -75.00% | -71.40% | -26.30% | -22.00% | 10.00% | |
| Source: Enverus | ||||||||