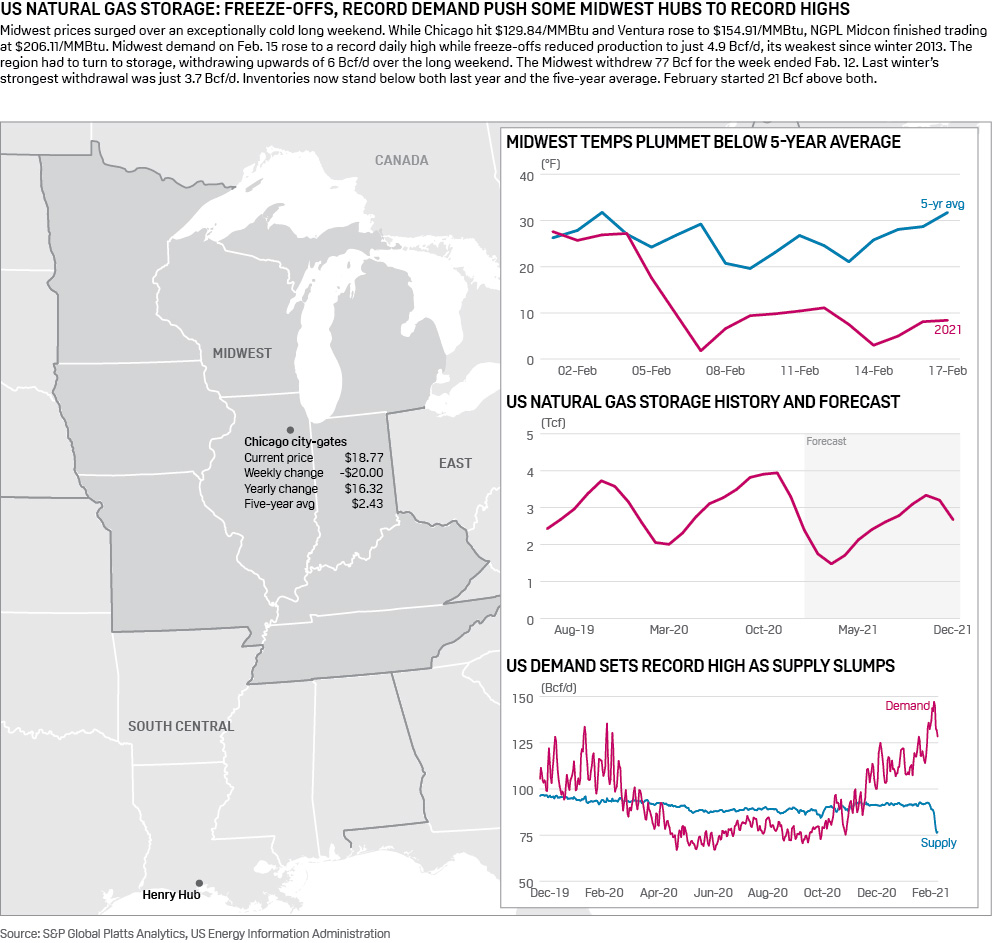
18 Feb 2021 | 22:34 UTC — New York
US working natural gas volumes in underground storage decline 237 Bcf: EIA
By Brandon Evans and Kent Berthoud
Highlights
Platts survey predicted 251 Bcf draw
Largest withdrawal in history possibly looms
US natural gas storage inventories posted the largest withdrawal of the winter last week with the largest pull ever possible for the week in progress as an arctic storm sweeps across the nation, propelling summer strip prices.
Storage inventories decreased by 237 Bcf to 2.281 Tcf for the week-ended Feb. 12 the US Energy Information Administration reported the morning of Feb. 18.
Natural gas prices gained ground this week, with the March NYMEX contract touching near $3.30/MMBtu earlier this week – although prices backed off to near $3.09/MMBtu following the storage report.
Temperatures across key producing regions of the country plummeted for the week ended Feb. 12 – sparking massive production curtailments. Record levels of production losses and heightened demand sparked huge gains in spot natural gas prices across the country – with multiple locations getting deep into the triple digits – with Henry Hub cash establishing an all-time high too.
The call on storage increasing by 13.3 Bcf/d week over week. On the demand side of the ledger, US consumption increased by roughly 13 Bcf/d as heating degree days jumped sharply. Outside of residential and commercial, gas-fired generation demand grew 1.7 Bcf/d week over week as lower wind generation and higher total loads pushed the call on thermal generation nearly 10% higher week over week. LNG sendouts decreased by nearly 50% week over week – with milder temperatures in the Northeast sparking the reduction, according to Platts Analytics.
The withdrawal was less than the 251 Bcf draw expected by an S&P Global Platts' survey of analysts. The pull proved much stronger than the 141 Bcf draw reported during the same week last year as well as the five-year average withdrawal of 142 Bcf, according to EIA data.
Storage volumes now stand 105 Bcf, or 4.4%, less than the year-ago level of 2.386 Tcf and 57 Bcf, or 2.6%, more than the five-year average of 2.224 Tcf.
Platts Analytics' supply and demand model expects a 369 Bcf draw for the week-ending Feb. 19, which would register as the largest weekly withdraw from working gas stocks in US history, according to EIA data.
US production was down 10 Bcf/d – with much of the losses stemming from weather induced curtailments in Texas, Southeast and the Midwest regions. Losses could be greater than current modeled output suggests, as sample declines have been pronounced.
The largest weekly storage decline on record stands at 359 Bcf, which was set for the week-ended Jan. 5, 2018. During that week, a "bomb cyclone" blasted its way across the US, prompting freeze-offs and pipeline-related outages, dropping supply by 3 Bcf/d. At that time, when the freeze-offs primarily hit the Midwest and Texas, production bounced back within a week.