


01 Oct 2020 | 20:40 UTC — New York
US working natural gas volumes in underground storage rise by 76 Bcf: EIA
Highlights
Build comes in below analysts' estimate of 78 Bcf
Smaller injections likely for weeks ahead
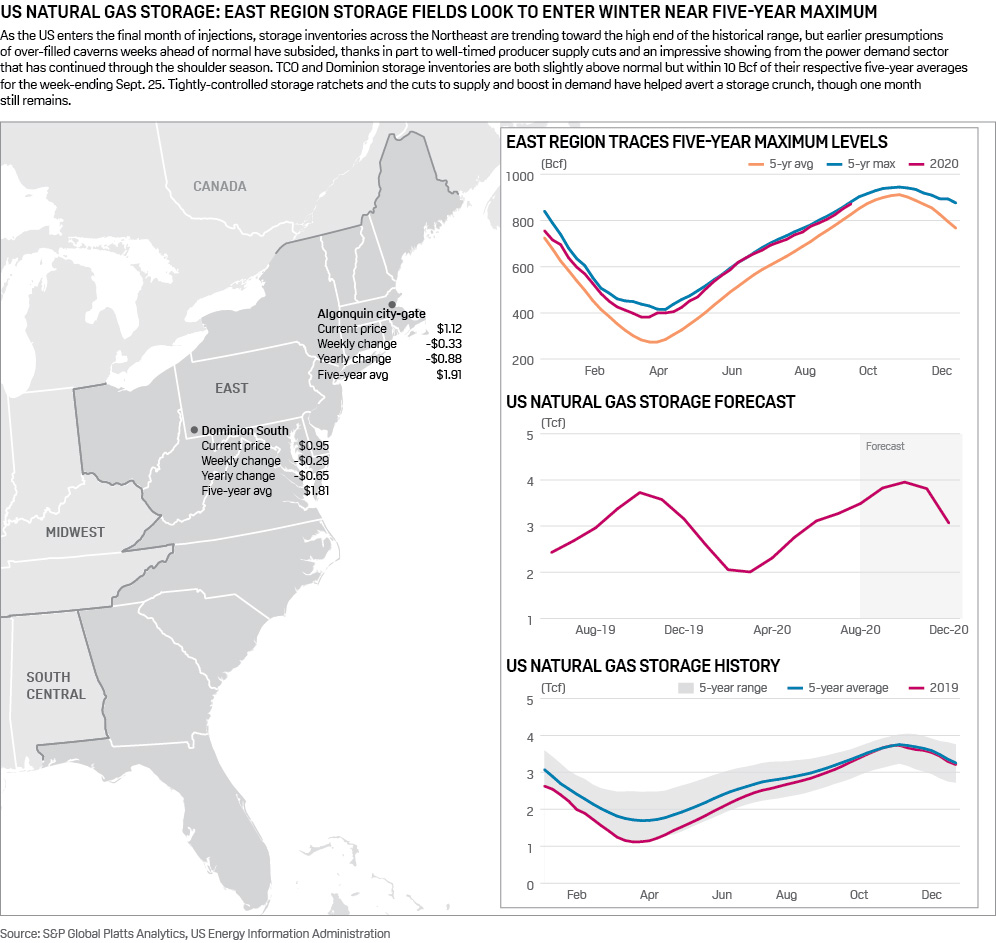
New York — US natural gas in storage rose roughly in line with analysts' expectations and the five-year average last week, but the Henry Hub winter strip continues to slip as power demand fades entering the shoulder season.
Storage inventories rose 76 Bcf to 3.756 Tcf for the week ended Sept. 25, the US Energy Information Administration reported the morning of Oct. 1.
After the survey missed the mark widely in both directions over the past two weeks, this injection was only slightly less than an S&P Global Platts' survey of analysts calling for a 78 Bcf build. Responses to the survey proved wide though, ranging from injections of 61 Bcf to 102 Bcf. The injection measured less than the 109 Bcf build reported during the same week a year ago, as well as the five-year average gain of 78, according to EIA data.
The injection was below the 109 Bcf build reported during the same week a year ago, as well as the five-year average increase of 78 Bcf, according to EIA data.
The US supply-and-demand balance during the week ended Sept. 25 saw little net change week on week. Supply was down 1.1 Bcf/d week on week to average 89.4 Bcf/d, led by an 800 MMcf/d decline in onshore production, mainly stemming from reduced Northeast output, according to S&P Global Platts Analytics. Downstream, total demand fell by 1.4 Bcf/d to an average of about 80 Bcf/d for the week. A 1.8 Bcf/d drop in power burn demand and a 1.4 Bcf/d drop in LNG feedgas deliveries were partly counterbalanced by a combined 1.7 Bcf/d increase in residential-commercial and industrial demand.
Storage volumes now stand 471 Bcf, or 14%, above the year-ago level of 3.285 Tcf and 405 Bcf, or 12%, more than the five-year average of 3.351 Tcf. The surplus versus last year has been reduced by more than 400 Bcf over the course of the injection season.
The NYMEX Henry Hub November contract shed 6 cents to $2.47/MMBtu following the release of the weekly storage report. Declines extended through the winter strip, with December through March trading roughly 3 cents lower.
S&P Global Platts Analytics' supply-and-demand model currently forecasts a 66 Bcf injection for the week ending Oct. 2, which would lower the surplus to the five-year average by 20 Bcf as about six net injections remain before the flip to the winter withdrawal season.
Total supplies this week are up 1.1 Bcf/d to average 90.5 Bcf/d, mainly from a nearly 1 Bcf/d rise in production that has been split among both onshore and offshore production wells. Downstream, total demand is up 1.7 Bcf/d on the week to an estimated 81.6 Bcf/d, led by a 1 Bcf/d recovery in LNG feedgas deliveries, and further bolstered by a 600 MMcf/d recovery in power plant deliveries.
Click here for full-size image