


20 Aug 2020 | 20:07 UTC — Denver
US working natural gas volumes in underground storage rise by 43 Bcf: EIA

Highlights
Build 1 Bcf below five-year average
September futures fall after release
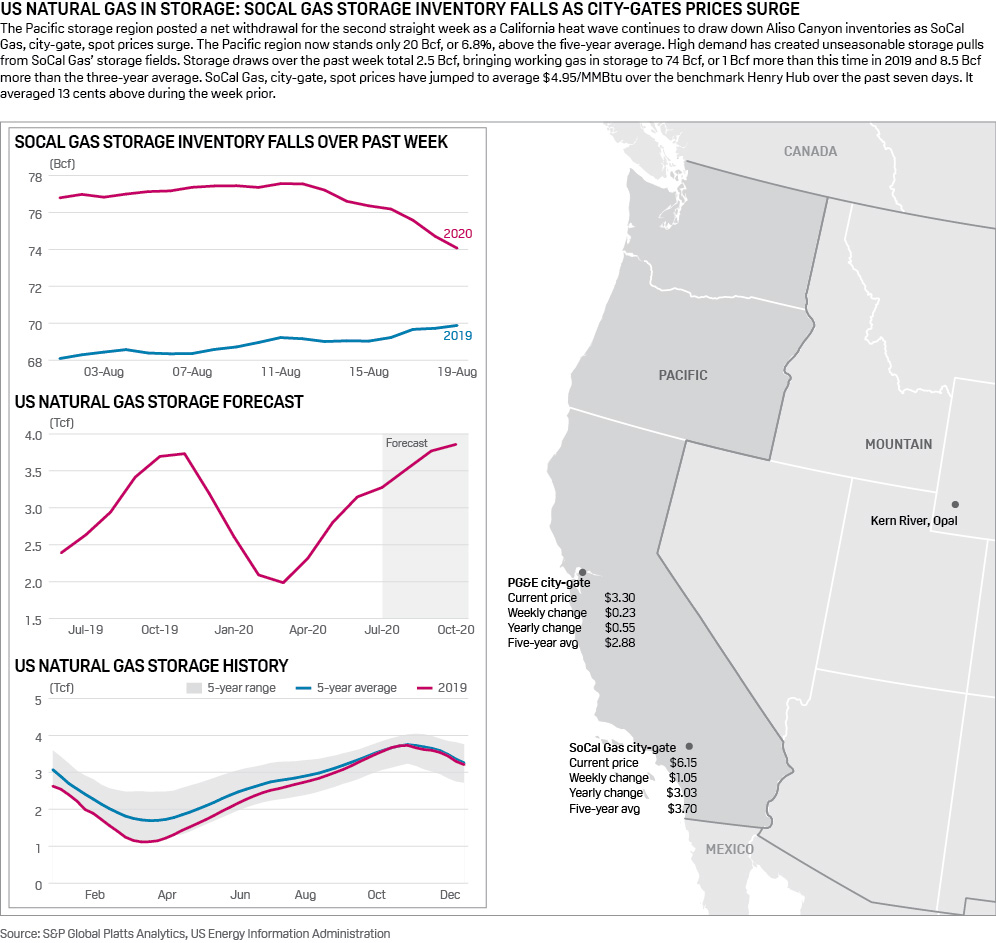
Denver — US natural gas stocks increased nearly in line with the five-year average in the week ended Aug. 14 despite net withdrawals being reported in the Pacific region and South Central's salt-dome facilities as Henry Hub strip prices slip slightly.
US underground natural gas storage inventories increased 43 Bcf to 3.375 Tcf in the week ended Aug. 14, the US Energy Information Administration said Aug. 20.
The injection was larger than the consensus expectations of analysts surveyed by S&P Global Platts, which called for a 39 Bcf build. Responses to the survey ranged from an injection of 34 Bcf to 51 Bcf. The injection was, however, smaller than the 56 Bcf build reported during the same week a year ago and almost in line with the five-year average increase of 44 Bcf, according to EIA data.
Storage volumes now stand 595 Bcf, or 21.4%, above the year-ago level of 2.780 Tcf and 442 Bcf, or 15%, higher than the five-year average of 2.933 Tcf.
US supply and demand balances grew tighter during the reference week as a surge in power burn demand helped offset rising supplies, particularly from onshore production gains, according to S&P Global Platts Analytics.
Total supply came in 1 Bcf/d higher during the week for an average 92.8 Bcf/d, led by a 800 MMcf/d increase in onshore production and a 400 MMcf/d increase in net Canadian imports, partly counterbalanced by a 200 MMcf/d drop in offshore production receipts. Total demand grew by 2.7 Bcf/d during the week to an average 86.6 Bcf/d, which was mainly the result of a 2.5 Bcf/d increase in powerburn demand, bolstered by a 500 MMcf/d increase in LNG feedgas demand as facilities in the US Gulf Coast continue to see higher LNG liquefaction processing.
The NYMEX Henry Hub September contract slid 5 cents to $2.37/MMBtu in trading following the release of the weekly storage report. The winter strip, November through March, fell by an average of 2 cents to $3.08/MMBtu.
Spreads from summer to winter have narrowed by nearly 10 cents over the last week to 63 cents, down from 72 cents a week ago and considerably wider than the roughly 90-cent spread seen at the beginning of this month.
Since the start of August, the balance of 2020 strip has risen almost 50 cents while the calendar 2021 strip has rallied 15 cents. Platts Analytics expects further upside to the winter and summer 2021 strips amid associated gas production declines.
Platts Analytics' supply and demand model currently forecasts a 38 Bcf injection for the week ending Aug. 21. This would lower the surplus to the five-year average by 11 Bcf. Total supplies have averaged 900 MMcf/d lower week on week, driven by a 600 MMcf/d drop in onshore production and by a 500 MMcf/d net decline in LNG sendout and net Canadian imports. Downstream, demand has grown weaker, with power sector demand leading the decline averaging 1.2 Bcf/d lower on the week.
The week following projects for a smaller build of 34 Bcf, which would measure just over half the five-year average.
Click here for full-size image