


23 Jul 2020 | 19:59 UTC — Houston
US oil, gas rig count grows by 6, Permian sees first rise since March: Enverus

Highlights
Oil rigs rise for third straight week to 206, up four
Bottom of current downcycle is here, analysts say
Fracking likely to tick up in Q3, while drilling stays flat
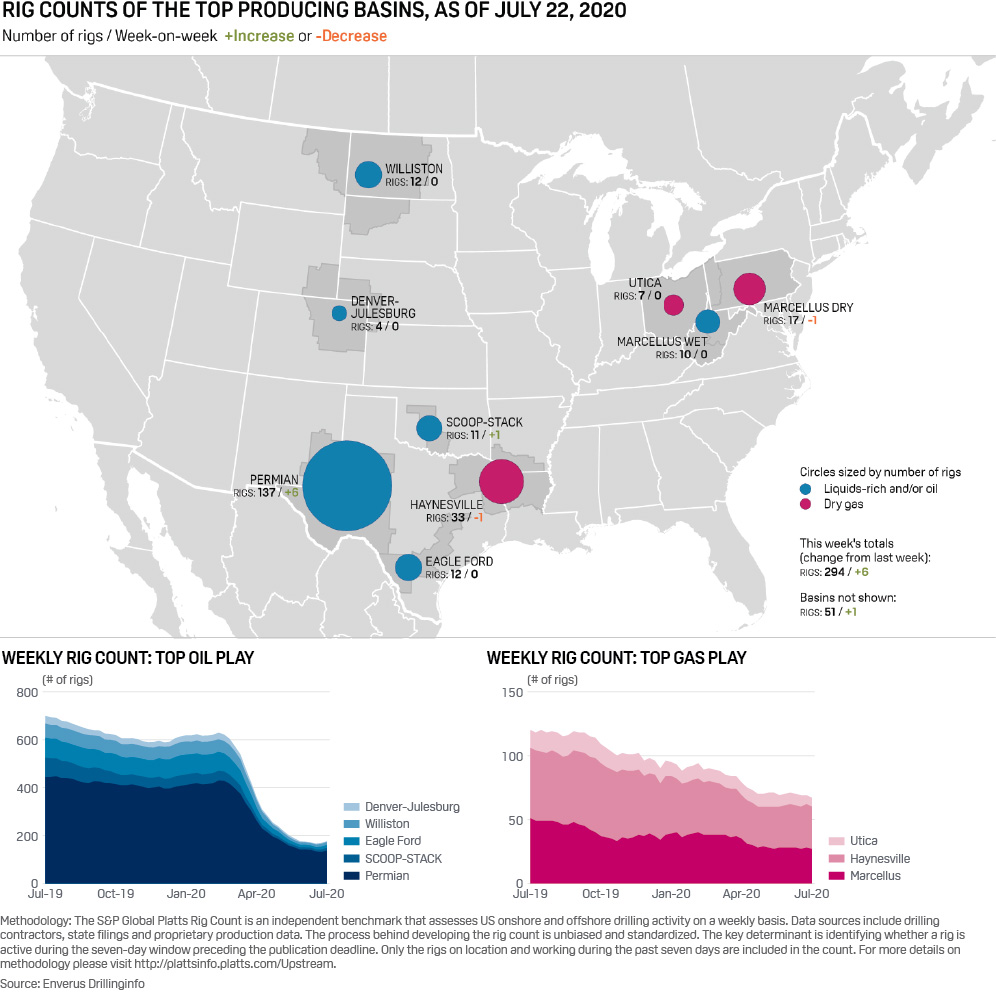
Houston — The US oil and gas rig count rose by six to 294 on the week, rig data provider Enverus said July 23, marking the second consecutive week of increases after more than four months of steep contraction from pandemic-induced low crude prices and decimation of global oil demand.
The Permian Basin of West Texas/New Mexico registered its first rig count gain in nearly five months, rising by six to 137 in the week ending July 22.
The US oil rig count rose for the third week in a row to 206, up by four after a 10-rig gain the previous week and one rig the week before that.
Two rigs on the week were added to the domestic natural gas fleet, for a total 88.
Rig counts in the seven other large US basins either were unchanged or up or down by one for the week.
At its lowest point in early July, the US rig count had lost nearly 560 units in four months.
The week's total rig increase, on top of a nine-rig jump the week before, came amid the start of oil service company earnings calls confirming widespread assumptions that domestic drilling is now at the trough of the current downturn and should remain tamped down into next year.
"Two consecutive weeks of [total US rig] increases could mean we've reached the bottom," Matt Andre, an analyst with S&P Global Platts Analytics, said.
"We were waiting for the Permian to bottom out, so [the current weekly increase in that basin] could be important," Andre said. "But again, that is only one week of data" and not a sure sign of a trend.
The Permian's recent addition of six rigs is the first rise in rig count in that play since early March, when it stood at 429. The basin lost nearly 300 rigs when it saw its lowest total July 15.
The Permian is the most active and prolific US basin, with about 4.6 million b/d of oil production, down from 4.9 million b/d in April, according to Platts Analytics. The Permian's out output far outpaces that of any other domestic play, and also produces about 12 Bcf/d of gas.
'Noise' could become weekly trend
Following steep weekly rig declines in US fields from March to May, rig counts for H2 2020 are expected largely flat and will likely inch up or down according to individual operators' drilling programs, said analysts, who call those slight weekly variations "noise" that doesn't necessarily suggest broader trends.
But as drilling rig counts largely flatten, US frac activity, should climb in the third quarter, analysts said. That would signal producers intend to start tackling their backlogs of already-drilled wells that prepare them for production.
"Our discussions with industry participants cement our belief that the US active frac spread [a unit of fracturing equipment and crew] count will climb plus or minus 10 in July and net additions will continue through September, especially if WTI can hang in at more than a $40/b," investment bank Tudor Pickering Holt said in a July 22 investor note.
US frac crews, or unit spreads, currently hover around 70, analysts said.
"[Our] corporate updates suggest that the Permian Basin will see the quickest and most meaningful rate of change [in fracking], which is what we saw in June when activity climbed around 30% month-on-month," Tudor Pickering Holt said.
Click here for full-size image

A slow second half
The round of second-quarter earnings calls was kicked-off in recent days with oilfield service providers Halliburton and Baker Hughes predicting sluggish drilling activity for the rest of the year alongside a bump-up in fracking.
"Drilling activity declines have slowed, and we believe the rig count should find a bottom sometime in the third quarter, but a meaningful inflection point in drilling seems further out," Halliburton CEO Jeff Miller said on the company's July 20 earnings call.
Miller, and also Baker Hughes CEO Lorenzo Simonelli, said US drilling and completions spending will be down 50% or more this year compared to 2019.
"While the US market appears to have troughed, and we started to see some improvements in our production-related businesses in June and July, visibility over the second half of 2020 remains limited, with any incremental activity closely tied to oil prices," Simonelli said during his company's July 22 call.
Domestic oil prices gained over the week ended July 22, while gas prices dropped nominally, according to S&P Global Platts Analytics estimates.
During that period, WTI averaged $41.28/b, up 84 cents; WTI Midland averaged $41.28/b, up 48 cents; and the Bakken Composite averaged $37.16/b, up $1.24/b.
Gas prices fell slightly, with Henry Hub averaging $1.68/MMBtu, down 6 cents on week, and Dominion South prices averaging $1.27/MMBtu, down 2 cents.
| US rig count decline may be near bottom | ||||||||
| Oil-focused basins | Gas-focused basins | |||||||
| Date | Permian | SCOOP/STACK | Eagle Ford | Williston | Denver-Julesburg | Marcellus | Haynesville | Utica |
| 3/4/2020 | 429 | 41 | 79 | 52 | 28 | 38 | 41 | 10 |
| 4/1/2020 | 374 | 34 | 63 | 47 | 21 | 38 | 37 | 10 |
| 5/6/2020 | 213 | 14 | 23 | 24 | 8 | 30 | 33 | 10 |
| 6/3/2020 | 157 | 10 | 14 | 12 | 7 | 27 | 33 | 11 |
| 6/24/2020 | 141 | 9 | 11 | 10 | 3 | 28 | 34 | 9 |
| 7/1/2020 | 140 | 9 | 9 | 10 | 3 | 28 | 33 | 9 |
| 7/8/2020 | 133 | 8 | 10 | 11 | 4 | 27 | 33 | 9 |
| 7/15/2020 | 131 | 10 | 12 | 12 | 4 | 28 | 34 | 7 |
| 7/22/2020 | 137 | 11 | 12 | 12 | 4 | 27 | 33 | 7 |
| 18-week change | -292 | -30 | -67 | -40 | -24 | -11 | -8 | -3 |
| -68.10% | -73.20% | -84.80% | -76.90% | -85.70% | -28.90% | -19.50% | -30.00% | |
| 4-week change | -4 | 2 | 1 | 2 | 1 | -1 | -1 | -2 |
| -2.80% | 22.20% | 9.10% | 20.00% | 33.30% | -3.60% | -2.90% | -22.20% | |