Featured Topics
Featured Products
Events
S&P Global Offerings
Featured Topics
Featured Products
Events
S&P Global Offerings
Featured Topics
Featured Products
Events
S&P Global Offerings
Featured Topics
Featured Products
Events
Language
Featured Products
Ratings & Benchmarks
By Topic
Market Insights
About S&P Global
Corporate Responsibility
Culture & Engagement
Featured Products
Ratings & Benchmarks
By Topic
Market Insights
About S&P Global
Corporate Responsibility
Culture & Engagement
S&P Dow Jones Indices — 7 Aug, 2020
By Liyu Zeng
This article is reprinted from the Indexology blog of S&P Dow Jones Indices.
In our paper, How Smart Beta Strategies Work in the Australian Market, our studies indicated that most factor indices in Australia exhibited distinct return characteristics during up and down markets. Indeed, different factor indices also displayed unique style and industry factor exposures, resulting in factor index performance differentials over the long term. In this blog, we examined the risk factor exposures, active risk, and excess return attribution for various S&P DJI Australian Factor Indices from Dec. 31, 2004, to May 29, 2020.
According to the factor exposure and return attribution table in Exhibit 1, the S&P/ASX 200 Momentum, S&P/ASX 200 Quality, and S&P/ASX 200 Low Volatility delivered better performance among various factor indices, mainly due to the high cumulative returns of their target style factors (momentum, profitability, and low volatility, respectively). All S&P DJI Australian Factor Indices had high exposures to their target style factors relative to the S&P/ASX 200, but unintended style factor exposures, industry biases, and stock-specific risk were also observed in various indices, and some of them had significant impacts on their excess returns. Return contribution from style factors was dominant for the S&P/ASX 200 Momentum and S&P/ASX 200 Quality, while the impact of stock-specific risks was pronounced in the S&P/ASX Small Ordinaries, S&P/ASX 200 Enhanced Value, and S&P/ASX Dividend Opportunities Index.
The S&P/ASX 200 Momentum attributed most of its outperformance to its target exposure to the momentum factor, while the impact of industry bias and stock-specific risk were minor. The outperformance of the S&P/ASX 200 Quality was mainly attributed to its target exposure to profitability and favorable industry biases, while its unintended tilts to small cap and momentum also attributed positively. Return attribution from the unexplained stock-specific risks was relatively insignificant.
The small-cap exposure attributed positively to the returns of the S&P/ASX Small Ordinaries, but the unintended exposures to high volatility, growth, and low profitability resulted in a significant negative return impact. Meanwhile, the target factors for the S&P/ASX 200 Enhanced Value and S&P/ASX Dividend Opportunities Index contributed negatively during the examined period, and the active exposures to low momentum and high volatility largely eroded the performance of these two indices. We also noticed that industry exposures and stock-specific risks posed significant negative impacts for the S&P Small Ordinaries, S&P/ASX 200 Enhanced Value, and S&P/ASX Dividend Opportunities Index.
For the S&P/ASX 200 Low Volatility, the target exposure was largely displayed as low market sensitivity (i.e., low beta), which generated significant excess returns for the index. Its small-cap bias also contributed positively, while its tilts to low momentum and high dividend yield, as well as unfavorable industry exposures, had a negative return impact. Different from what we saw from other Australian factor indices, stock-specific risk contributed favorably to the S&P/ASX 200 Low Volatility.

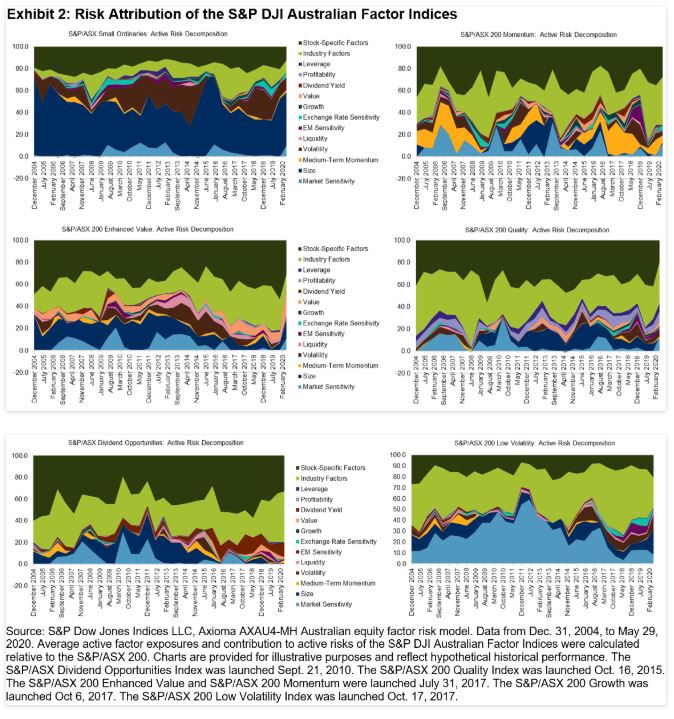
To understand the main sources of portfolio risks of the various factor indices, we decomposed the active risks of the S&P DJI Australian Factor Indices into different style risk factors, industry factors, and stock-specific risks. As shown in Exhibit 2, the risk composition was unique for different factor indices, and changed over time. Total risk attribution from style factors varied across a wide range for factor indices, from an average of 69.8% for the S&P/ASX Small Ordinaries to 30.5% and 27.2% for the S&P/ASX 200 Quality and S&P/ASX Dividend Opportunities Index, while total style factors accounted for 45.8%, 39.7%, and 38.7% of active risk for the S&P/ASX 200 Low Volatility, S&P/ASX 200 Momentum, and S&P/ASX 200 Enhanced Value, respectively.
Target style factors were key risk contributors for most factor indices, mainly due to high active exposures to the target factors. However, risks associated with unintended style factors, industry factors, and stock-specific risk were pronounced in some indices. For instance, the small-cap factor constituted a significant portion of active risk in most of the S&P DJI Australian Factor Indices over this period. On the other hand, industry factor risks were significant in the S&P/ASX 200 Low Volatility, S&P/ASX 200 Quality, and S&P/ASX Dividend Opportunities Index, accounting for 39.3%, 34.0%, and 30.4%, on average, of their total active risks, while stock-specific risks attributed to 42.3%, 36.7%, and 35.5% of the total active risks in the S&P/ASX Dividend Opportunities Index, S&P/ASX 200 Value, and S&P/ASX 200 Quality, respectively.

As we can see from this risk/return attribution analysis, various factor portfolios had distinct factor exposures that drove performance differently. Decomposing the source of active returns and risks helps explain the behavior of factor portfolios in different market environments, especially for those with high risk/return attributions from unintended style factors and industry factors.
Content Type
Theme
Location
Language