IN THIS LIST

How Smart Beta Strategies Work in the Australian Market

ETFs in Insurance General Accounts – 2020

The S&P Composite 1500®: An Efficient Measure of the U.S. Equity Market

A Survey of Mexican Insurance Investment Officers

Profitability Screening in Australian Small Caps

How Smart Beta Strategies Work in the Australian Market

Contributor Image
Priscilla Luk

Managing Director, Global Research & Design, APAC

S&P Dow Jones Indices

Contributor Image
Liyu Zeng

Director, Global Research & Design

S&P Dow Jones Indices

EXECUTIVE SUMMARY

With increasing interest in smart beta strategies in the Australian equity market, we examined the effectiveness of six well-known risk factors, size, value, low volatility, momentum, quality, and dividends, in the Australian equity market from Dec. 31, 2004, to May 29, 2020.

  • Quintile analysis showed that low volatility, high momentum, and high quality delivered the most persistent absolute and risk-adjusted return spreads, but small cap and value did not generate incremental return in the Australian market.
  • Among the Australian factor indices offered by S&P Dow Jones Indices (S&P DJI), the quality and momentum indices delivered the highest excess returns, while the low volatility and dividend indices had lower volatility than the S&P/ASX 200.
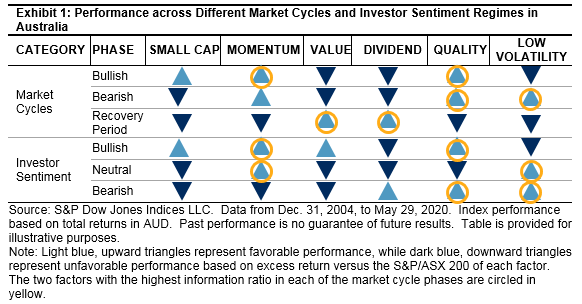
  • Our macro regime analysis showed that most factor portfolios in Australia were sensitive to local market cycles and investor sentiment regimes.
  • The distinct cyclicality of factor performance in Australia indicated its potential for implementation of active views on the local equity market.

How Smart Beta Strategies Work in the Australian Market: Exhibit 1

FACTOR-BASED INVESTING IN THE AUSTRALIAN EQUITY MARKET

Smart beta strategies have gained significant attention in the asset management industry, and the exchange-traded products (ETPs) tracking factor indices have experienced significant asset growth since the end of 2008. Factor-based strategies are a category of smart beta strategies that target specific risk factors.  They share some common characteristics with passive investing, such as rules-based construction, transparency, and cost-efficiency, and they also share features of active investing in that they aim to enhance return and reduce risk compared to market-cap-weighted indices.

Single-factor indices are constructed explicitly to capture a specific risk factor and exhibit distinct cyclicality in response to a changing market environment, which also makes them ideal tools for implementation of active views. 

In Australia, although the adoption of factor-based investing by local market participants is behind the U.S. and some Asian markets (like Japan), the growth of factor-based ETPs has accelerated in recent years, achieving 46% growth in net assets in the past 18 months in local currency terms as of Dec. 31, 2018, and accounting for 10.5% of the Australian ETF market. Dividend products still dominate the Australian factor-based ETP market, but we observed the proliferation in categories and the increasing demand for factor-based index-linked products within the Australian equity market.

Based on the performance contribution analysis for the S&P/ASX 200 portfolio, the Financials and Materials sectors contributed about 63.6% of the total performance of the portfolio for more than 15 years.  At a stock level, the top five large-cap contributors (BHP Group Ltd, Commonwealth Bank of Australia, Westpac Banking Corporation, CSL Limited, and Australia and New Zealand Banking Group Limited) together contributed approximately 49% of the total portfolio performance over the same period.  This suggests that sector or size bias might have  a significant impact on the excess return of factor portfolios in the Australian market.

In this paper, we examined the effectiveness of six well-known risk factors (size, value, low volatility, momentum, quality, and dividend) in the Australian equity market and the behavior of these factors under different market regimes.

pdf-icon PD F Download Full Article

ETFs in Insurance General Accounts – 2020

Contributor Image
Raghu Ramachandran

Head of Insurance Asset Channel

S&P Dow Jones Indices

INTRODUCTION

In our first report in 2015, we used historical trends to project that insurance companies would double their use of exchange-traded funds (ETFs) in five years. Now five years later, usage of ETFs in insurance general accounts has indeed doubled since 2015. In the one-year period ending Dec. 31, 2019, insurance companies increased their ETF assets under management (AUM) by 16% to reach USD 31.2 billion. We saw companies increase their use of Equity and Fixed Income ETFs. While the overall use of ETFs increased, we did observe some parts of the industry that had been active in using ETFs pull away. Although the use of Fixed Income ETFs increased, the use of Systematic Valuation (SV) declined.

OVERVIEW

As of year-end 2019, U.S. insurance companies had USD 31.2 billion invested in ETFs. This represents a tiny fraction of the USD 4.4 trillion of ETF AUM and an even smaller portion of the USD 6.7 trillion in admitted assets of U.S. insurance companies. Exhibit 1 shows the use of ETFs by U.S. insurance companies over the past 16 years.

pdf-icon PD F Download Full Article

The S&P Composite 1500®: An Efficient Measure of the U.S. Equity Market

Contributor Image
Phillip Brzenk

Managing Director, Global Head of Multi-Asset Indices

S&P Dow Jones Indices

Contributor Image
Hamish Preston

Head of U.S. Equities

S&P Dow Jones Indices

EXECUTIVE SUMMARY

Launched in 1995, the S&P Composite 1500 (hereafter the "S&P 1500") serves as a benchmark indicator for U.S. equity market performance, aggregating price movements of S&P 500®, S&P MidCap 400®, and S&P SmallCap 600.

The S&P 1500 also increasingly serves as a basis for constructing portfolios designed to deliver a "market" return at lower cost than those active managers who offer to beat it. We shall examine the S&P 1500 from both perspectives, as well as examining its merits in comparison to popular alternatives. In particular, we observe that:

  • The sizeable representation of U.S. companies means tracking U.S. equity market performance may be relevant to investors, globally;
  • The S&P 1500 has outperformed the S&P 500, historically;
  • Incorporating smaller companies in a U.S. market benchmark provides a more holistic view of the U.S. economy (see Exhibit 7); and
  • Compared with other U.S. equity market indices, the S&P 1500 avoids relatively illiquid, lower priced, and lower quality stocks (see Exhibit 1).

MEASURING THE U.S. EQUITY MARKET

U.S. companies represented an average of 49.47% of the S&P Global BMI’s capitalization at each year-end between 1995 and 2019, more than five times the average weight of second-place Japan (9.39%). Given that U.S. companies also accounted for over 50% of the market capitalization in most global industries at the end of 2019, many investors may need to turn to the U.S. in order to obtain certain exposures.

The S&P 1500 is designed for investors seeking to replicate the performance of the U.S. equity market, or benchmark against a representative universe of tradable stocks. The S&P 1500 combines three widely followed indices—the S&P 500, S&P MidCap 400, and S&P SmallCap 600—in proportion to their free-float market capitalizations. Hence, the S&P 1500 uses the same inclusion criteria as its three component indices.

pdf-icon PD F Download Full Article

A Survey of Mexican Insurance Investment Officers

Contributor Image
Raghu Ramachandran

Head of Insurance Asset Channel

S&P Dow Jones Indices

In February 2020, S&P Dow Jones Indices and the Association of Mexican Insurance Companies (AMIS) conducted our second annual survey of insurance investment officers in Mexico about the state of the local insurance industry.

The objective of the annual survey is to better understand how Mexican insurers invest and allocate their excess capital and how they view issues such as regulation, passive strategies, and the implementation of environmental, social, and governance (ESG) investment criteria. With each annual survey, it is our aim to reflect the current state of the insurance investment landscape from the perspective of the investment decisionmakers.

We administered the survey between Feb. 4 and Feb. 28, 2020, prior to the aggressive spread of COVID-19 in North America and the declaration of the virus as a global pandemic by the World Health Organization. As such, the coronavirus and its potential implications for the financial markets may not have been as top of mind for respondents as they likely would be today. Answers to questions regarding expected returns, adjustments in allocations, concerns, and economic projections represent the respondents' perspectives pre-crisis, under comparatively "normal" market conditions. This report summarizes respondents' perspectives on the following themes:

  • Investments and asset allocation, with a focus on excess capital;
  • Sensitivity to and potential impacts of regulation;
  • The implementation of ESG criteria within the investment process;
  • Indexing and the use of passive strategies and instruments; and
  • 2020 economic indicators.

pdf-icon PD F Download Full Article

Profitability Screening in Australian Small Caps

Contributor Image
Akash Jain

Director, Global Research & Design

S&P Dow Jones Indices

Contributor Image
Priscilla Luk

Managing Director, Global Research & Design, APAC

S&P Dow Jones Indices

EXECUTIVE SUMMARY

This paper examines the effectiveness of a profitability screen on improving return and reducing volatility and drawdown for Australian small-cap stocks. 

We also demonstrate the benefit of applying a profitability screen to the S&P/ASX Small Ordinaries, the benchmark for small-cap stocks in Australia.

  • On average, 28% of companies in the S&P/ASX Small Ordinaries were unprofitable over the period studied, in contrast to 9% in the S&P/ASX 50. Small-cap companies with positive earnings per share (EPS) historically outperformed the unprofitable companies on both absolute and risk-adjusted bases.
  • The S&P/ASX Small Ordinaries Select is designed to track profitable small-cap companies in Australia. The index’s addition of a profitability screen helped it to outperform its benchmark by 1.2% per year from Sept. 20, 2002, to Dec. 31, 2019.
  • Sector allocation and stock selection effects both contributed to the excess return of the S&P/ASX Small Ordinaries Select, with the sector allocation effect explaining a larger part of it.
  • The S&P/ASX Small Ordinaries Select had higher dividend yield and active profitability factor exposures compared with the S&P/ASX Small Ordinaries.

SMALL-CAP BEHAVIOR IN AUSTRALIA

In 1992, the capital asset pricing model (CAPM) evolved into the Fama & French three-factor model to include size and value as risk factors in addition to market risk, with the aim to help better explain a portfolio’s risk/return characteristics. Inclusion of small-cap companies offers diversification and potential for higher returns.

Exhibit 2 shows the return correlation of various common Australian investment classes.  Australian small caps had return correlations of 0.83 and 0.91 with large and mid caps, respectively.  Among the three size categories in Australian equities, small caps had the lowest correlation with Australian bonds, Australian REITs, and international equities.

pdf-icon PD F Download Full Article

Processing ...