


S&P Dow Jones Indices — 10 Mar, 2021
A Change in Fortune

By Anu Ganti
This article is reprinted from the Indexology blog of S&P Dow Jones Indices.
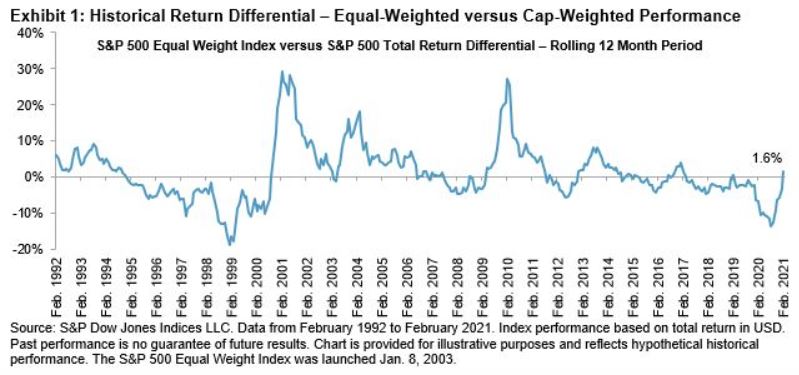
Three months ago, we observed that times of severe underperformance for Equal Weight can bode well for future performance. This reflection had become reality by the end of February. After almost four years of underperformance, the S&P 500® Equal Weight Index outperformed the S&P 500 by 1.6% over the past 12 months, as we see in Exhibit 1. This result may be the beginning of a trend in mean-reversion that we observe from the exhibit’s historical peaks and troughs.
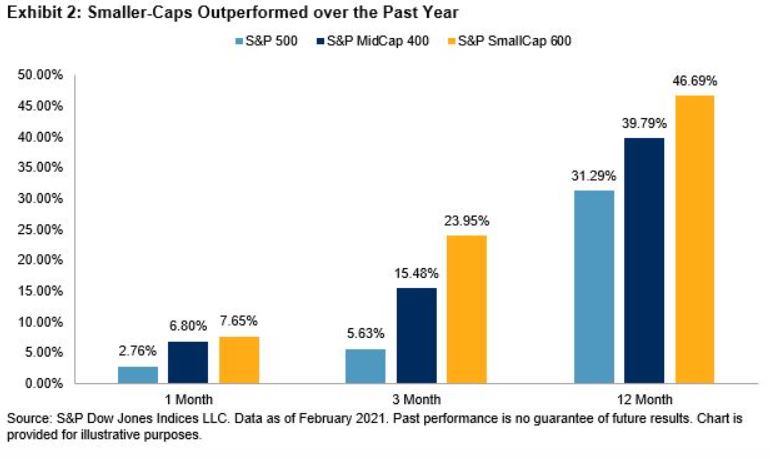
The turning of the tide for Equal Weight was primarily driven by strength in smaller caps, as Equal Weight has a small-cap bias. Exhibit 2 shows the strong outperformance of the S&P MidCap 400® and S&P SmallCap 600® relative to their large-cap counterpart.
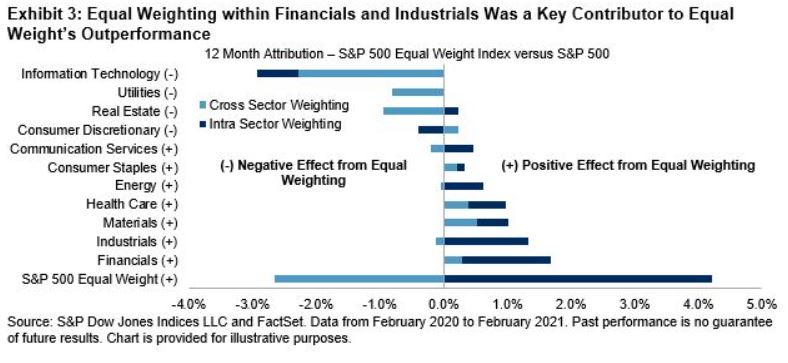
The impact of smaller-cap outperformance at a sector level is noticeable from Exhibit 3’s 12-month attribution of the S&P 500 Equal Weight Index versus the S&P 500. Equal weighting within Financials and Industrials was a key contributor to the recovery in Equal Weight.
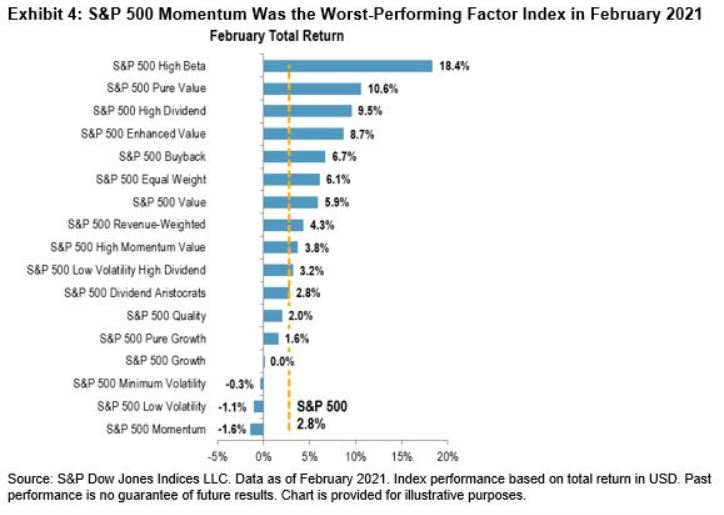
In addition, Equal Weight has a natural anti-momentum bias, as by definition the strategy sells relative winners and purchases relative losers at each rebalance. Exhibit 4 illustrates that the S&P 500 Momentum was the worst performing factor in February, furthering Equal Weight’s positive trajectory.
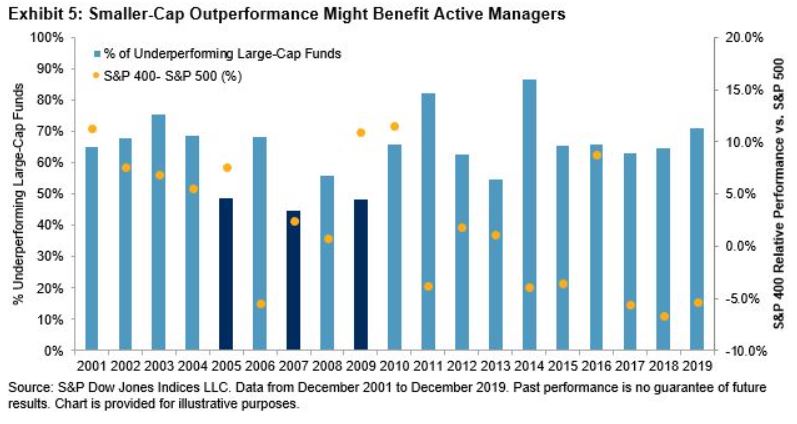
The comeback of smaller-caps and Equal Weight might have positive implications for active managers, as their portfolios tend to be closer to equal than cap weighted. Exhibit 5 plots the underperformance of large-cap funds compared to the relative performance of the S&P 400TM versus the S&P 500, as a proxy measure for smaller-cap outperformance. We notice that the three years when most active managers outperformed (2005, 2007, and 2009) all coincided with smaller-cap outperformance.
Finally, we’ve written previously about how the current environment compares to the tech bubble of the late 1990s. Concentration levels in the cap-weighted S&P 500 exceed those of 1999; an equal weight alternative could potentially offer above-average diversification benefits.
The posts on this blog are opinions, not advice. Please read our Disclaimers.