
17 September 2026
Multidimensional Global Energy Pathways
Synthesis Report
With inputs from: The Institute of Energy Economics, Japan
© 2026 by S&P Global Inc. All rights reserved.
Foreword

S&P Global
Daniel Yergin, Ph.D.
Vice Chairman
Daniel Yergin is Vice Chairman of S&P Global. He is a highly respected authority on energy, international politics, and economics, and a Pulitzer Prize winner. He chairs S&P’s CERAWeek conference, which CNBC has called “the Super Bowl of world energy”.
Time Magazine said, “If there is one man whose opinion matters more than any other on global energy markets, it’s Daniel Yergin.” The New York Times called him “America’s most influential energy pundit” And The Wall Street Journal described him as “the energy sage”.
He plays a leadership role in the Commodity Insight research at S&P Global and recently led studies on LNG as a major new U.S. export industry and on “Copper in the Age of AI”.
Dr. Yergin’s most recent book The New Map: Energy, Climate and the Clash of Nations is described by NPR as “a master class on how the world works,” and in The Washington Post as “a tour de force of geopolitical understanding.,” It has been translated into 14 languages.
A Pulitzer Prize winner, Dr. Yergin is the author of the bestseller The Quest: Energy, Security, and the Remaking of the Modern World. The Quest, which The New York Times said it is “necessary reading for C.E.O.’s, conservationists, lawmakers, generals, spies, tech geeks (and) thriller writers.” Bill Gates summed up his review of The Quest by saying, “This is a fantastic book.”
Dr. Yergin is known around the world for his book The Prize: The Epic Quest for Oil Money and Power, which was awarded the Pulitzer Prize. It became a number one New York Times best seller and has been translated into 20 languages.
Of Dr. Yergin’s book Commanding Heights: The Battle for the World Economy, which has been translated into 13 languages, The Wall Street Journal said, “No one could ask for a better account of the world’s political and economic destiny since World War II.” Both The Prize and Commanding Heights were made into award- winning television documentaries for PBS and BBC, which Dr. Yergin co-produced, co-wrote, and narrated.
Dr. Yergin is a senior trustee of the Brookings Institution and a member of the Energy Advisory Council of the Dallas Federal Reserve. Dr. Yergin served on the U.S. Secretary of Energy Advisory Board under four U.S. presidents.
Among his honors, both the Prime Minister of India and the United States Association have presented Dr. Yergin with a “Lifetime Achievement” awards and the U.S. Department of Energy awarded him the first “James Schlesinger Medal for Energy Security.” The University of Pennsylvania presented him with the first Carnot Prize for “distinguished contributions to energy policy.” Dr. Yergin was awarded the Gold Medal of the President of the Republic of Italy for combining “an understanding of the dynamics of the market with a broad view of the forces of geopolitics as he seeks to point the way to the positive outcomes for the world community.
Dr. Yergin is a member of the advisory boards for the Columbia University Center on Global Energy policy and the MIT Energy Initiative.
Dr. Yergin holds a BA from Yale University and an M.A. and Ph.D. from Cambridge University, where he was a Marshall Scholar
The thinking and policies that have sought to shape the energy transition over the last decade have collided with the realities of economic development, growing energy demand, geopolitics and the pace of technological progress in recent years. Russia’s invasion of Ukraine put energy security back at the center of energy policies globally. The war in the Middle East in 2026, the on-off closure of the Strait of Hormuz and more recently transit through the Red Sea – these have made clear the reality that the global energy system is highly interconnected and remains deeply exposed to disruption of critical supply routes.
At the same time, a new challenge has emerged on the demand side. The rapid build-out of data centers, driven by artificial intelligence and the broader digital economy, is adding material new load to electricity systems in advanced economies and China. Yet, with all this happening, the fundamental fact is that the largest source of long-term energy demand growth will come from emerging markets and developing economies (EMDEs), where energy needs are driven by economic development, industrialization, urbanization and rising incomes. This reality is often underplayed in discussions about energy transition.
A recent paper that I jointly authored with Peter Orszag and Atul Arya, highlighted the challenges to the pace of energy transition that have become clear post-COVID and the resulting need for pragmatism. Renewable energy sources including wind and solar PV are growing rapidly, and this growth is essential to meet increasing electricity demand. However, renewables are growing into an energy system in which oil, gas and coal demand is also growing and in which hydrocarbons are deeply embedded in industry, transport, power generation, materials production and for national security.
This new study by my colleagues at S&P Global Energy, in collaboration with the Institute of Energy Economics, Japan, provides a timely, original and valuable analysis on the future energy system that balances the essential elements -- energy demand to fuel economic growth, energy security, affordability and emission mitigation. The need to reduce emissions coexists with the need for economic growth, and for reliable and affordable energy. The pace of transition to low carbon energies is set by the physical realities of infrastructure, supply chains, permitting, capital availability and technological progress – and political forces.
The contribution of this study is its approach. It starts with the actualities of demand growth in the EMDEs rather than targets. Second, it sets realistic expectations on objectives and on what can be achieved. It also explicitly evaluates the trade-offs that will need to be recognized. It provides an analytical framework for evaluating future pathways for advanced economies and for EMDEs. The report introduces the concept of energy prosperity, assessed through a new forward looking Energy Prosperity Indicator that provides quantitative assessment at a country level of key energy metrics.
Energy transition is continuous and everlasting. Its course will be multidimensional, regionally differentiated and multi-speed – not linear and rapid as promoted in the popular narrative. A pragmatic path forward begins by recognizing the trade-offs rather than passing over them.

Professor Tatsuya Terazawa
Chairman and CEO of The Institute of Energy Economics, Japan
Chairman and CEO of The Institute of Energy Economics, Japan
There are already many outlooks for the future of energy. So why have we developed these “Multidimensional Global Energy Pathways”?
First of all, I believe that there is a strong demand for a realistic, credible outlook for the future of energy. Many outlooks developed recently start from predetermined outcomes and develop scenarios through a back casting approach. There is certainly significance in such normative outlooks, but they lack reality, which makes it hard to use them as a basis for real world decision‑making by policy makers and investors. We need outlooks that start from current realities and reflect the actual choices policy makers and investors face, providing an actionable basis for their decisions.
Second, I believe that many existing outlooks focus on the energy supply side but generally pay less attention to the demand side. They often underestimate the strong energy demand growth among emerging markets and developing economies (EMDEs). A realistic outlook must fully account for the strong energy demand growth among the EMDEs.
Third, most recent outlooks are prepared in accordance with the single criterion of emission reduction. But EMDEs pursue many other objectives including affordability and energy security. I believe that such multiple objectives must be incorporated into alternative pathways of EMDEs.
Fourth, many outlooks tend to analyze EMDEs in an aggregate manner. But EMDEs are not monolithic. They have different natural endowments, constraints, and priorities leading to various pathways. The “Multidimensional Global Energy Pathways” are based on an in-depth country by country analysis of 12 major EMDEs. Considering the growing weight of EMDEs for the world economy and energy requirements, I believe that this bottom-up approach is essential to make the outlook both credible and realistic.
Fifth, choice of energy systems will lead to trade‑offs. While this is understood in a general manner, there have been insufficient frameworks to assess the various trade-offs. This report provides a new Energy Prosperity Indicator (EPI) as a framework to quantify such tradeoffs.
I sincerely hope that these “Multidimensional Global Energy Pathways” could serve as a realistic, credible and actionable basis for policy makers and investors in their decision-making about the future of energy.
Contacts
Report inquiries
Karen Logue | karen.logue@spglobal.com
Geoffrey Warr | geoff.warr@spglobal.com
Media inquiries
Jeff Marn | jeff.marn@spglobal.com

Context: A Return to Pragmatism
The global energy system has been in a state of continuous transition for decades, influenced by geopolitics, market factors, and technological change. In recent years, the system has entered a period of sustained volatility: geopolitical disruption, supply chain fragility, affordability pressures and fast‑changing national policies. To navigate this complexity, the energy and climate discourse needs a path back to pragmatism - objective and inclusive discussion recognizing the very different perspectives between advanced and developing economies on their respective energy and climate priorities. As highlighted in the International Energy Forum report “Shaping a Living Roadmap for Energy Transition (2023)”, long term energy pathways must be ‘multidimensional’, recognizing the interplay and trade‑offs between energy security, affordability, and sustainability, as well as the system constraints, delivery realities and regional conditions that determine how energy systems actually evolve.
Within this context, this new study offers a realistic, nationally differentiated approach to long-term energy, emissions and climate projections. This synthesis, and the associated in‑depth analysis, provides a set of differentiated energy pathways for emerging markets and developing economies (EMDEs)1 and for advanced economies. The analysis will facilitate a return to a discourse grounded in the complex realities of national energy systems.
1 The EMDE group of countries as defined by the IMF includes around 150 developing and emerging economies. In this study, China is not included in the EMDE grouping.
Impacts of the Iran war and Strait of Hormuz disruption
The pathways analyzed in this report do not explicitly forecast long-term impacts from the Iran conflict and the effective closure of the Strait of Hormuz (SOH). Whether the effective closure, and the associated longer-term risks, results in permanent demand destruction for oil and gas, or simply shorter-term demand repression, will become apparent over the next few years. The SOH disruption has primarily impacted Asia and once again highlighted the vulnerabilities of energy importing countries, many of which are emerging and developing economies, to supply and price shocks. It will take time to fully understand the longer-term implications of actions such as increased coal use and reduction in oil imports by China, on the global energy system. As this report highlights, EMDEs can reduce such dependencies by accelerating electrification and by increasing share of renewable sources, but also by developing domestic and regional fossil fuel resources and new supply chains. The crisis has created a new focus on energy security and diversification – key components of the Energy Prosperity Indicator introduced in this report.
Summary of Key Findings
- Future growth in energy demand will come from EMDEs
By 2060, energy demand in the emerging markets and developing economies (EMDEs) could grow by over 60%, equivalent to adding another China to the global energy system, despite significant efficiency gains. Meeting this demand growth is the principal energy challenge of the coming decades. Data centers in advanced economies will add material load but this remains modest compared to the dominant factor - overall EMDE demand growth. We note that artificial intelligence (AI) may also reduce demand through efficiency and optimization. EMDEs will need to greatly expand their energy systems, while most advanced economies will focus on transforming existing systems where total consumption will be largely flat or declining.
- The future energy system will be defined by coexistence of multiple supply sources
The evolution of the global energy system is likely to be additive as much as substitutive. While electrification and low-carbon energy sources expand rapidly across all pathways, fossil fuels may still provide more than half of global energy in 2060. Coal, oil and natural gas continue to play important roles in power system reliability, industrial production, transport and energy security. The result is a prolonged period of coexistence, in which multiple energy sources operate in parallel.
- Electrification based on renewable energy sources is key to emissions reduction – but faces limitations
Electrification and renewables drive emissions reduction. In an aggressive decarbonization pathway, solar and wind capacity rises eight-fold globally and eighteen-fold in EMDEs by 2060. But “electrify everything” to eliminate emissions is not feasible. Costs rise sharply once generation from intermittent renewables exceeds around 50–60%, resulting in total power system investment requirements of $50 trillion through 2060 in an aggressive emissions reduction pathway. Technologies such as carbon capture and storage and hydrogen will be adopted in specific applications, but the impact will be secondary to electrification.
- The Energy Prosperity Indicator (EPI) highlights the unique trade-offs facing each country
A new Energy Prosperity Indicator (EPI) provides a decision-support framework for assessing the trade-offs that policymakers face across multiple energy objectives. The EPI is not meant to be normative, to rank one country against another. Rather it is a tool for policymakers as they consider trade-offs. The EPI assesses energy affordability, security, system resilience, air quality, and national economic benefits. For example, EPI analysis highlights how national energy security can come from renewables and/or domestic fossil fuels depending on national resource endowment. The diversity of EPI outcomes demonstrates why there is no ‘one size fits all’ roadmap for energy and emissions.
- Achieving net zero globally this century will be a major challenge
Achieving global net zero greenhouse gas (GHG) emissions this century will be very difficult. By 2060, global GHG emissions remain at 35% of current levels even in our most aggressive decarbonization pathway, with the toughest challenges still ahead. Select advanced economies may achieve carbon neutrality by 2060 or come close, in part through negative non-energy emissions. But most EMDEs will not achieve the goal until late century at the earliest. With few exceptions, EMDEs that have announced net zero targets are highly unlikely to achieve them in any plausible pathway.
- 2°C target is becoming increasingly difficult
A global pathway that limits warming to 2°C by end of century is feasible but challenging. Such a pathway can accommodate rising EMDE emissions in the near term if the advanced economies and China undertake aggressive decarbonization actions. A 1.5°C pathway is no longer achievable – in the absence of unforeseen technology breakthroughs or extreme multi-decade global economic disruption. Temperature outcomes across pathways span a relatively narrow 2.0°C to 2.8°C range. All pathways bring growing climate risks and greater need for adaptation.
Using the Pathways
The new energy pathways start from four key inputs:
- development-led demand growth,
- differentiated national circumstances,
- system constraints,
- delivery realities.
The pathways aim to guide capital allocation where it cuts emissions most effectively, strengthens energy security, supports growth and manages rising climate risk. Considering these aspects, the report offers the following use cases for policymakers, regulators and companies:
- The 2.0°C Emissions Reduction Pathway provides an ambitious ‘no overshoot’ basis for emissions target‑setting and transition risk assessment. Within this pathway, sectoral and company decarbonization roadmaps could be differentiated by location, considering levels of economic development and national emissions trajectories.
- The Current Realities Pathway provides a realistic basis for climate physical risk / resilience assessment, with a warming outcome of 1.9°C by 2050 and 2.8°C by end of century. It provides a credible starting point for adaptation planning.
An intermediate Diverging Priorities Pathway offers a plausible trajectory for a highly bifurcated global energy system, with intermediate global emissions and temperature outcomes.
Over time, demand, policy and cost signals will indicate which pathway is emerging, recognizing that disruptive technologies may create step changes not captured in the pathways.

Design principles: What makes these pathways different?
This new report provides a fresh and fundamentally different approach to long-term projections of energy, emissions and global temperature.
Rather than beginning with a predetermined emissions or temperature outcome, or projections based on national policy targets, it starts with demand, country‑level realities and system constraints. It then assesses how different priorities could shape plausible futures. The result is an actionable view of the energy future for policymakers, investors and corporations in assessing strategy, emissions targets, transition risk, valuation and climate resilience planning.
The central tenet is a structural shift in the location of energy demand growth toward emerging markets and developing economies. Economic development – not policy aspiration alone – will be the primary driver of demand, energy mix and technology adoption. The transition is therefore not defined only by decarbonizing existing demand in advanced economies and China. It is increasingly defined by how the world meets large volumes of new demand while also reducing emissions, strengthening security and preserving affordability. The pathways presented in this report are designed to reflect these evolving realities. They differ from many existing scenario frameworks in four important ways.
First, the pathways are demand-led, with particular focus on the EMDEs. They do not begin with a predetermined emissions or temperature outcome. They begin with a bottom-up country‑level view of projected demand for energy services in the major EMDEs, then assess how that demand could realistically be met under different policy priorities.
Second, the pathways are grounded in country-level realities. The analysis builds on detailed energy system modeling of twelve major emerging markets and developing economies, which together represent a significant share of global demand growth.
This approach captures differences in resource endowments and development priorities.
Third, the pathways are constrained by delivery realities: finance, infrastructure, supply chains, land availability, institutional capacity and the pace of technology adoption. This keeps the analysis grounded in what can plausibly be built, financed and operated. Many studies skip over these real-world on-the-ground constraints. Large scale commercialization of new disruptive energy or emissions technologies, such as nuclear fusion, is assumed not to occur within the forecast period, though this is acknowledged as an upside uncertainty.
Fourth, the pathways are multi-objective. They assess energy system evolution not only through the lens of emissions reduction, but also through affordability, reliability, energy security and broader energy prosperity.
All pathways also recognize what the 2015 UN Paris Agreement described as the “differentiated responsibilities” for emissions reduction between advanced and developing economies. This means recognizing that they differ in economic resources and capabilities. A country with a $3,000 per capita average income is in a very different position from a country with $60,000 per capita average. The extent of this differentiation varies across pathways, as highlighted in the report.
Scenarios, pathways and forecasts
The alternative outlooks presented in this report are described as ‘pathways’ rather than ‘scenarios’. While they incorporate features of scenarios (e.g., they are not definitive forecasts, they are long term, they are underpinned by alternative input assumptions) they differ in one fundamental aspect. Scenarios, including those produced by S&P Global and by IEEJ respectively, typically provide holistic storylines for the future which integrate differing internally consistent assumptions around economic growth, geopolitics, demographics, and technology development. The pathways in this report hold global macroeconomic, geopolitical and technological assumptions constant and, by varying national energy policy priorities, isolate how different choices around energy system development alone shape outcomes for affordability, security and emissions reduction.
Pathways construction
The analysis uses a two-stage architecture – first analyzing the fast-growing EMDE energy markets and then building the global picture. Stage one begins with detailed bottom-up modeling of twelve major EMDEs selected for their scale, diversity and importance to future demand growth: Mexico, Brazil, South Africa, Nigeria, Egypt, Türkiye, Saudi Arabia, India, Indonesia, Viet Nam, Thailand, and Malaysia.
Other EMDE countries are assessed using a simplified top-down approach to give a total aggregate view for all EMDEs (excluding China). These results are then integrated with pathways for advanced economies and China to create a coherent global outlook that preserves country-level detail while allowing comparison across pathways.

Pathway definitions
Three global pathways are defined within this framework.
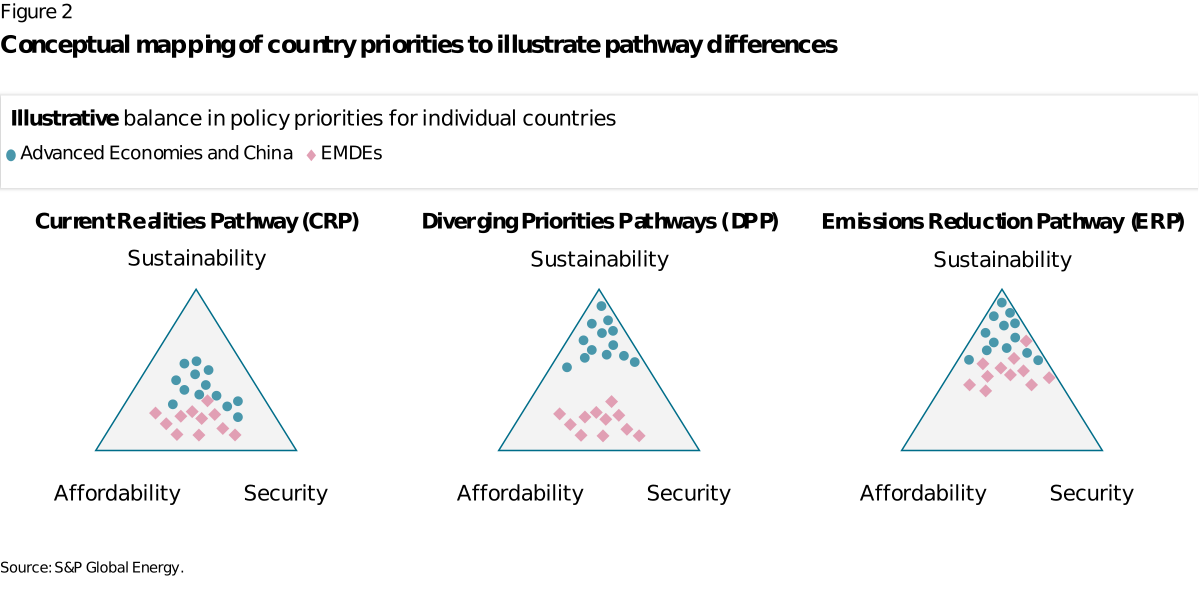
The Current Realities Pathway (CRP) reflects a continuation of the complex reality of a global energy system with multiple, differing and ever-changing energy policy objectives:
- Lack of global consensus around reducing emissions; volatile and multi-objective energy & climate policy in many countries.
- Emphasis on energy affordability, especially in EMDEs.
- Continuation of legacy systems; investment in low carbon solutions constrained by finance and affordability.
The Emissions Reduction Pathway (ERP) characterizes a broad global consensus and drive on prioritizing reduction in GHG emissions, while recognizing the differentiated responsibilities of advanced economies and EMDEs in achieving this. Key characteristics include:
- Reducing GHG emissions at the fastest credible rate as a key objective of energy policy in all countries – within realistic boundaries set by security, affordability and other factors.
- Coordinated global action based on equitable outcomes.
- Strong investment in energy efficiency to curtail demand growth.
The Diverging Priorities Pathway (DPP) reflects a twin-track pathway in which the advanced economies and China prioritize reducing emissions, as per ERP, while the EMDEs continue to emphasize energy affordability and security, as per CRP:
- Strong climate action across advanced economies and China,
- Investments in low carbon energy in EMDEs where this supports energy security and affordability goals.
Countries will prioritize objectives according to individual circumstances, resulting in a broad spectrum of national priorities and outcomes within the envelope of each pathway. Figure 2 provides an illustrative conceptual mapping of individual country priorities for each of the pathways using a simple energy trilemma framework.

01. Future growth in energy demand will come from EMDEs
A changing center of gravity: EMDEs as the primary demand driver
A defining feature of the pathways is the concentration of energy demand growth in emerging markets and developing economies.
By 2060, EMDE primary energy demand grows over 60% in the Current Realities Pathway, adding 155 EJ2 to the global energy system - equivalent to adding another China. This is despite significant improvements in energy efficiency over the period.
The advanced economies (AEs) and China, by contrast, see broadly flat primary energy demand over the long term, as final energy consumption rises slowly and energy efficiency improves. Power demand from data centers will be significant, and artificial intelligence (AI) will add new load to electricity systems in all regions, with commensurate increase in emissions. However, at the global level these impacts remain relatively small compared with the broader scale of long-term energy demand growth across EMDEs. AI may also reduce demand by improving efficiency, optimization, asset utilization and system management, making its net effect more complex than a simple increase in power consumption. Nevertheless, there remains considerable uncertainty over the impact of AI and data centers, with potential upside on the demand projections shown in Figure 3.


This EMDE energy growth reflects population expansion, urbanization, industrialization and rising incomes. As access, reliability and affordability improve, households, businesses and industries consume more energy. Efficiency helps dampen demand, but it does not offset the scale of development-driven growth or the resulting demand for infrastructure, fuels and technology deployment within the EMDEs. Nevertheless, energy consumption per capita, and notably the use of electricity, remains far below the advanced economies throughout the forecast period.
2 Exajoules (EJ) are units of energy in the International System of Units (SI) and are a widely accepted measure for comparing and combining alternative sources of energy
Substitution and expansion
The scale and persistence of this demand growth in EMDEs has important implications for how the transition is understood. A large share of new low-carbon supply will be needed simply to serve incremental demand in EMDEs. It will not immediately displace existing fossil fuel use. The result is an additive transition: the system expands in absolute terms, multiple fuels and technologies coexist for longer, and emissions reduction is slower than growth in renewable capacity alone might imply.
For the EMDEs, meeting this growing need for energy is core to industrial and economic development. It is also the central force shaping infrastructure needs, fuel demand, emissions trajectories and investment requirements. This dynamic is particularly pronounced in lower income economies. In these markets, improvements in access and reliability can unlock previously unmet demand. This leads to step changes in consumption rather than gradual transitions from one energy source to another.
Energy demand in alternative pathways
In the Current Realities Pathway, global primary energy demand increases by over 10% (72 EJ) by 2040 and approximately one quarter (161 EJ) by 2060. In contrast, in the Emissions Reduction Pathway, overall global demand remains broadly stable out to 2060, with an 86 EJ increase in the EMDEs offset by an 83 EJ decline in the advanced economies and China, as more rapid efficiency gains and electrification offset much of the growth in underlying energy services. An intermediate outcome is observed in the Diverging Priorities Pathway, where demand grows by 72 EJ by 2060, again with all growth concentrated in the EMDEs.
Key takeaway
The global energy transition will be shaped less by a simple fuel substitution story and more by the scale, location and character of new demand growth. Economic development in EMDEs is therefore a central driver of long-term demand, investment needs and technology adoption.
02. The future energy system will be defined by coexistence of multiple supply sources
Renewables grow fast but fossil fuels remain significant
The additive dynamic of an EMDE-driven energy expansion leads to a prolonged period in which multiple energy sources operate in parallel. This is reflected in certain common trends across the pathways:
- Renewable energy becomes the dominant source of incremental supply, particularly after 2035 in emissions-focused pathways.
- Electrification shifts demand toward the power system but does not eliminate underlying fuel use; fossil fuels continue to provide baseline supply, flexibility, and industrial inputs.
- No primary energy source will be completely ‘transitioned out’ for the foreseeable future.
The persistence of this coexistence reflects structural constraints, which are most strongly represented in the Current Realities Pathway:
- Existing infrastructure has long lifetimes, often several decades.
- Capital stock turnover is gradual, particularly in industry and power generation.
- Demand growth absorbs a large share of new capacity, particularly in EMDEs.
The additive nature of the transition also has important implications for how progress is interpreted.
First, rapid growth in renewable capacity does not necessarily translate into immediate declines in fossil fuel use. In many cases, both increase simultaneously, reflecting the scale of demand growth. Metrics focused on shares or rates of change can obscure underlying system expansion.
Second, emissions reductions follow a similar pattern. Carbon intensity declines relatively quickly, but absolute emissions respond more slowly in countries where demand growth is strong.
Key takeaway
The transition is defined by expansion as much as substitution. Low-carbon energy must first meet growing demand in EMDEs before it can materially displace fossil fuel use. The result is an energy mix in which electrification and renewables become increasingly critical, while coal, oil and gas remain important in specific sectors and regions for reliability, convenience and security.

Fossil fuel persistence across all pathways
Fossil fuels in aggregate decline long term across all pathways, but they remain structurally embedded through to 2060 and beyond.
For example, in the Current Realities Pathway:
- Fossil fuels remain a dominant part of the energy mix, with share declining from close to 80 percent today to around 60 percent by 2060.
- Absolute oil demand declines only modestly, from 101 million barrels per day in 2025 to 93 million barrels per day in 2060, including feedstocks.
- Natural gas demand grows by nearly 20% by 2040 and by over a third by 2060.
- Coal declines markedly, falling 40% by 2060, but still remains critical for secure, low‑cost power, especially in EMDEs.
In the Emissions Reduction Pathway:
- Oil demand falls to approximately 59 million barrels per day by 2060.
- Natural gas demand remains broadly flat to 2040 but declines by nearly one third by 2060 as renewables and batteries rapidly scale up.
- Coal declines sharply, halving by 2040 and falling nearly 80% by 2060, particularly in the power sector.
The intermediate Diverging Priorities Pathway sees demand trajectories for fossil fuels between these two pathways.

Despite the variations, one conclusion is consistent across pathways: while fossil fuels decline as a share of the system, a full fossil fuel phase-out is not envisaged over the next 40 years and will be unlikely before the end of the century. For the EMDEs, gas is likely to function less as a short-lived transition fuel and more as a destination fuel: a long-term component of the energy mix that supports reliability, industrialization and the displacement of more carbon‑intensive coal.

Fossil fuels persist because they perform functions that are difficult or expensive to replace. They provide dispatchable capacity in power systems, high-temperature heat and feedstocks in industry, liquid fuels for long-distance transport and strategic security for countries with domestic resources. In addition, hydrocarbons play a growing role in supporting the transition itself, through:
- Production of materials required for low carbon energy infrastructure (plastics, composites, chemicals).
- Providing energy to supply chains linked to renewable energy, electrification, and energy storage.
As a result, investment in oil and gas supply remains necessary in all pathways. The rate of production decline from existing fields means replacement supply is required even when demand is falling. The Current Realities Pathway will require close to US$14 trillion capital investment in upstream oil and gas supply through 2060, an average of US$300–400 billion per year. The Emissions Reduction Pathway envisages over US$11 trillion of investment over the same period.
Regional variation in fossil fuel use and its implications
The role of fossil fuels varies across regions depending on level of economic development and domestic resource endowment.
- In EMDEs, hydrocarbons remain prominent, reflecting rapid demand growth, affordability considerations, and domestic resource availability. Oil demand across the EMDEs increases by 40% by 2060 and demand for natural gas increases by 58% in the Current Realities Pathway.
- In advanced economies and China, fossil fuel demand declines in all pathways, supported by stronger policy frameworks and low/no long-term energy demand growth.
One consequence is that in specific contexts, targeted fossil fuel investment in EMDEs may be more consistent with the principles of the UN Paris Agreement than similar investment in advanced economies, particularly where it supports development, energy security or displacement of higher-emissions energy. Investment to reduce emissions can also be more effective in EMDEs, where existing energy systems are often more carbon intensive and where replacing coal or inefficient fuels can deliver larger global emissions benefits per dollar invested than in advanced economies.
Developing location-relevant decarbonization pathways for industrial sectors will therefore require a more sophisticated view of where emissions occur and where energy is ultimately used. This is especially important for international energy companies, whose supply chains and products often cross borders. A company may produce hydrocarbons in an advanced economy for export and use in a developing economy, meaning that both upstream emissions and downstream Scope 3 product-use emissions need to be assessed in context. LNG is a clear example: imported LNG underpins long‑term economic growth in multiple developing economies in the pathways presented in this report, and in some countries, it can also displace higher‑emissions coal-based generation.
These net global emissions benefits are generally not recognized in the policies and regulations of the producing country, underscoring the need for transition frameworks that consider global outcomes.
Key takeaway
Fossil fuels remain embedded because they support power system reliability, industry, transport, feedstocks and, in some cases, energy security. The balanced transition narrative in this report recognizes both the critical growth of electrification and renewables and the continuing role of coal, oil and gas in specific sectors and regions.
03. Electrification based on renewable energy sources is key to emissions reduction – but faces limitations
Electrification as a key transition vector
Electrification is the most important decarbonization lever across all pathways. It enables low-carbon power to reduce direct fossil fuel use in transport, buildings and parts of industry, and it is central to any robust decarbonization pathway. Electrification of demand is delivered through, for example:
- Rapid uptake of electric vehicles in road transport.
- Increasing penetration of electric heating and cooling in buildings.
- Gradual electrification of low- and medium‑temperature industrial processes.
In all pathways electricity demand grows faster than total energy demand, reaching average 38% of final energy demand by 2060 in the Current Realities Pathway from around 22% today, and more than doubling to 47% in the Emissions Reduction Pathway.

Nevertheless, the pathways reflect the practical limits that start to become apparent long before full system electrification is achieved. Heavy industry, air and marine transport and some building uses remain difficult to electrify at acceptable cost or performance. Transportation is the most difficult sector to electrify. Currently, electricity provides 2% of the sector’s energy globally, and this only rises to 14% in the CRP and 28% in the ERP by 20603.
Even the somewhat easier-to-electrify residential sector sees only around 50% of end use energy provided by electricity by 2060, as natural gas, LPG and traditional biomass retain significant market share.

3 These percentages represent the share of total energy provided by electricity. The higher efficiency of electric motors versus internal combustion engines means they do not reflect the relative market shares of electric vehicles and other electrified forms of transportation.
Electrification, renewables and emissions reduction
Electrification delivers meaningful emissions reductions in all pathways, but its impact is bounded by sectoral coverage and system constraints. The Emissions Reduction Pathway reveals two limitations:
- The limits to electrifying final energy demand (discussed above).
- The limits to fully decarbonizing electricity at acceptable system cost.
In most countries, decarbonization of electricity is principally achieved through deployment of intermittent solar and wind generation. In the Emissions Reduction Pathway, a credible 2°C pathway, installed solar and wind generation capacity rises eight-fold globally by 2060 to reach 28,000 GW, with an eighteen-fold increase occurring in the EMDEs. This is accompanied by an even faster relative expansion of grid battery power capacity, rising from 250 GW to over 6,200 GW in 2060. Global nuclear generation also more than doubles by 2060.

From a regional perspective, the move from fossil-fuel to renewables generation occurs relatively more slowly in the EMDEs, particularly in the Current Realities Pathway, where additional renewable power is principally deployed to meet additional demand. The advanced economies and China see a much faster transition, with fossil fuels in the power system almost entirely replaced by renewable and nuclear energy by 2060 in the Emissions Reduction Pathway.
From a cost perspective, in countries with low renewables penetration, solar and wind can be competitive with thermal generation even after accounting for full grid expansion and integration costs4. But the expectation of continuously declining renewable system costs and ever faster deployment becomes more challenged as penetration rises. Once intermittent solar and wind generation exceeds around 50–60%, integration costs rise rapidly, requiring transmission, storage, demand response, curtailment management and thermal backup capacity5. The Emissions Reduction Pathway will require cumulative capital investment of $50trillion globally through 2060 in power generation, storage, transmission and distribution – with solar and wind generation increasing from 18% of the total currently to 73% in 2060.
The practical challenge is therefore whether power systems can expand, decarbonize and remain reliable at the required pace, at affordable cost and within the limits of available finance.

4 Detailed analysis of system expansion requirements and renewable integration costs in the two pathways has been undertaken for twelve large EMDEs out to 2060.
5 This is consistent with the earlier findings in Yu Nagatomi et al. “Evaluating the System Integration Costs and Deployment Potential of Variable Renewable Energy”, in Institute of Energy Economics, Japan (IEEJ) Outlook 2026 Challenges and Opportunities for Decarbonizing the Energy Sector in Emerging Economies, and with Obane et al. “Japan’s energy scenario up to 2050 : Topic 1 Strategies for Reducing Power System Costs” for IEEJ’s 60th Anniversary Event: Japan’s Energy Scenarios towards 2050
04. The Energy Prosperity Indicator (EPI) highlights the unique trade-offs facing each country
Energy Prosperity as an organizing framework
A primary aim of the report is to provide practical insights into the implications of different energy system choices for policymakers and investors. With this aim, the report introduces the concept of energy prosperity, assessed through a new Energy Prosperity Indicator (EPI). The EPI provides quantitative assessment at a country level of key energy metrics. It is forward looking and, in this first issue of the report, evaluated for twelve major EMDEs out to 2060 to highlight the trade-offs, if any, between the components of energy prosperity and reducing emissions.
The EPI is not intended to compare or rank countries. It is a non-judgmental tool to help policymakers understand how different pathways affect outcomes within their own national context and help them assess trade-offs and make decisions. Evaluating the EPI may help explain why two countries with similar emissions ambitions may choose very different transition strategies.
EPI definition and evaluation
The Energy Prosperity Indicator consists of five primary components:
- National energy security,
- Power system resiliency,
- Energy affordability,
- Energy-related air quality,
- National benefits from energy production.
Each EPI component consists of one or more subcomponents, which are evaluated, weighted and aggregated to provide the EPI component score. For example, energy affordability is derived from forecast energy costs in the transport, residential and industrial sectors. While the subcomponents are absolute values, for example the average cost of energy for residential ($/MJ), the five primary metrics are normalized to enable analysis of trends and trade-offs. For each component, and each country, the 2025 score is set to 1.0. Increases in the score represent an improvement in that metric while reductions represent a decline.
EPI outcomes for select countries
The EPI is assessed for twelve major EMDEs out to 2060 for both the Current Realities Pathway and the Emissions Reduction Pathway. Figure 14 provides a high-level snapshot of key outcomes.

The EPI assessment provides several key insights:
- The trade-offs between emissions reduction and energy prosperity are highly country specific – there is no ‘one size fits all’ outcome or policy template. Nevertheless, a few general trends are apparent.
- With few exceptions, pursuing emissions reduction goals increases long term system-wide national energy costs and reduces relative affordability. Across the major EMDEs, energy costs are expected to rise over the long term in both pathways, but per capita incomes rise faster, meaning that energy becomes more affordable – but more so in the Current Realities Pathway.
- Conversely, for most EMDEs, national energy security, measured through energy import dependence, is enhanced through greater electrification and growth of domestic renewable energy. EMDEs endowed with large fossil fuel resources are more able to enhance energy security through development of these resources (Figure 15).
- Local air quality improvement is an additional benefit from pursuing CO2 emissions reduction. This is a significant driver in countries experiencing major air pollution challenges such as India.
- The Emissions Reduction Pathway requires much higher investment in power system expansion. This results in greater local job creation, especially in those countries able to maximize domestic supply chains. Corresponding loss of jobs in coal, oil and gas may prove politically contentious in some countries.
- In many cases, trade-offs exist between the components of the EPI: for example, the challenge of providing affordable low-cost electricity while ensuring power system resiliency.
The diversity of EPI outcomes explains why there is no realistic basis for assuming all countries will converge on a single optimal pathway, and why global outcomes remain spread across a range of trajectories rather than converging toward a single endpoint.

Key takeaway
There is no single route to affordable and secure energy. For fossil fuel importers, security may mean faster electrification and renewables. For resource-rich countries, it may mean greater domestic fossil fuel production. The trade-offs are country-specific and shaped by geography, infrastructure and resource endowment. The EPI provides a novel tool for policymakers to better understand these trade-offs in their decision-making.
05. Achieving net zero globally this century will be a major challenge
The challenge of net zero emissions: bending the curve
The pathways produce markedly different trajectories for energy-related emissions, reflecting the speed of electrification, renewable deployment, efficiency gains and fossil fuel phase-down. Some advanced economies and China could get close to zero energy-related emissions by 2060. But the EMDEs will, with few exceptions, not achieve this goal until the end of the century at best. This has direct implications for transition risk and valuation, particularly where asset pricing, portfolio alignment or corporate strategy assumes rapid convergence toward global net zero by mid-century.
In the Current Realities Pathway, total energy-related greenhouse gas emissions decline slowly over the period, from 41 GtCO2e in 2025 to 36 GtCO2e in 2040 and 32 GtCO2e in 2060. This despite a 40% reduction in the emissions intensity of the global energy system. In the Emissions Reduction Pathway, energy emissions decline more rapidly as electrification, efficiency and power-sector decarbonization accelerate – decreasing by 37% by 2040 to 26 GtCO2e and by 68% by 2060 to 13 GtCO2e. However, even in this pathway, unabated fossil fuels remain embedded in hard-to-abate sectors and in power system balancing.

Early gains, then diminishing returns
The challenge of deep decarbonization is where the gap between ambition and deliverability becomes most visible. Early emissions gains come from efficiency, fuel switching and renewable deployment. These measures are relatively cost-effective and scalable, leading to significant reductions in emissions intensity over the next two decades across all pathways. In all countries, emissions reductions become progressively harder to achieve over time. Improvements in key drivers such as energy intensity, electrification rates, and renewable deployment begin to slow as systems approach technical and economic limits and as attention shifts to harder to abate sectors such as:
- Heavy industry (steel, cement, chemicals).
- Long-distance transport (aviation, shipping, heavy freight).
- Non-energy emissions linked to industrial processes.
In these sectors:
- Electrification is limited or not feasible.
- Alternative solutions, such as hydrogen or carbon capture, are less mature.
- Costs are higher and deployment is more complex.
As a result, the pace of emissions reduction slows over time, even in pathways where decarbonization is prioritized.

Non-energy and total greenhouse gas emissions
Non-energy emissions account for slightly over one fifth of total GHG emissions today. In the Current Realities Pathway, they remain largely unchanged out to 2060. In the Emissions Reduction Pathway, policy actions are envisaged to also drive down non-energy emissions, with these being reduced by more than half by 2060. This will require a series of interventions across agricultural, industrial and waste management practices, as well as reversal of land-use change – principally deforestation6. This pathway also assumes use of direct air capture (DAC) to remove 2% (0.4 GtCO2e) of residual emissions by 2060. In the intermediate Diverging Priorities Pathway, these interventions are applied in the advanced economies and China only.

As a result, total greenhouse gas (GHG) emissions follow similar pathway trajectories to energy-related emissions, with a modest decline from 53 GtCO2e to 44 GtCO2e in the CRP and to around 18 GtCO2e in the ERP by 2060. This points to a slower and more uneven decline in total greenhouse gas emissions than implied by net zero narratives (Figure 19).
The report emphasizes the differentiation between the advanced and developing economies. Nevertheless, each country faces a unique set of opportunities and challenges, resulting in notable differences in individual country emissions. Figure 20 shows how energy-related emissions vary across countries in the two groups, highlighting there is no single linear pathway or timeline to net zero.


6 Achieving the required land-use carbon sink would require approximately 150–200 million hectares of highly productive forest, equivalent to the size of Mexico, under optimistic sequestration assumptions.
7 LULUCF = Land use, land use change, and forestry
06. 2°C target is becoming increasingly difficult
The emissions results point to an important but caveated7 temperature conclusion: limiting warming to 2°C by the end of the century is achievable though increasingly challenging; a 1.5°C outcome is not achievable under currently plausible assumptions.
The ERP offers a ‘no overshoot’ pathway which limits warming to 2°C. It recognizes that EMDE energy emissions will rise over the next decade before, at best, declining only gradually thereafter. It also supposes heavy adoption of nature-based and other non-energy interventions. This pathway is more consistent with development realities than a global net zero 2050 / 1.5°C trajectory and provides a more credible basis for emissions target-setting and transition risk assessment.
An alternative pathway, represented by the CRP, that reflects a continuation of current multidimensional national policy objectives, limited global cooperation on climate change, and the continuing long-term role of legacy energy systems, anticipates a temperature increase of around 2.8°C by the end of the century. Such a pathway may be useful as a basis for adaptation and investment planning.

7 Global temperature outcomes are estimated using the Hector reduced-complexity climate model, calibrated to be consistent with the IPCC Sixth Assessment Report (AR6), and are reported as the median warming outcome above pre-industrial levels. Results are subject to the inherent uncertainties of reduced-complexity climate modeling.
The Emissions Reduction Pathway represents an ambitious roadmap for reducing emissions through to 2060. In this pathway global warming exceeds 1.8°C by mid century, so, to reduce warming to 1.5°C by the end of the century, large scale ‘negative emissions’ (CO2 removal) would be required. A simple analysis indicates this would require average annual removal of over 25 GtCO2 over the period 2060 – 2100: approximately 60% of current annual global energy-related emissions. Utilizing novel technologies such as direct air capture (DAC) and bioenergy with carbon capture and storage (BECCS) to achieve half of this removal could cost upwards of US$6 trillion per year, around 5% of current global GDP, and would involve insurmountable supply chain and CO2 storage challenges. If the other half was achieved through afforestation and reforestation, the required sink would be comparable to establishing a net new forested area the size of the Amazon rainforest by the end of the century. Accelerating large scale emissions removal activities to pre-2060 would reduce the annual requirements somewhat, and other measures could also be applied. But even so, while CO2 removal offers some potential to limit end-of-century warming to below 2°C, getting the world back to 1.5°C by 2100 is not feasible - in the absence of unforeseen technology breakthroughs or extreme multi-decade global economic recession.
Taken together, the results point to a future energy system that is larger, slower to decarbonize, more capital-intensive, more uncertain and more differentiated than many existing narratives suggest.
- Demand growth in EMDEs means that many national energy systems must both expand and decarbonize: low-carbon energy must first meet rising demand before it can materially displace fossil fuel use.
- Fuel mix and emissions trajectories will vary with levels of economic development, geography and resource endowment.
- The pace of transition is not determined by ambition alone: it is bounded by the speed at which infrastructure can be permitted and built, capital can be mobilized, technologies can scale, supply chains can expand and consumers can adopt new solutions.
- Electrification and renewables – while central to decarbonization – face infrastructure, cost and system integration limitations. As a result, fossil fuels phase down rather than phase out.
- Global net zero is unlikely this century, even if achieved by the advanced economies and China.
- Without unforeseen technology breakthroughs or extreme global economic disruptions, temperature outcomes will exceed the ambitious targets set at the time of the UN Paris Agreement in 2015.
- Robust planning requires achievable pathways. Risk of capital misallocation increases if non‑feasible net zero goals are used as the basis for target-setting and investment planning.
- All pathways bring growing climate risks, requiring greater investment in adaptation, and greater costs from extreme weather events.
Uncertainty becomes an important planning feature. Technological disruption, policy shifts and cost declines could accelerate change in some sectors, while infrastructure bottlenecks, affordability pressures and social priorities could slow delivery in others. Acknowledging these uncertainties gives decision‑makers a more credible basis for strategy, risk assessment and capital allocation.
The practical implication is to monitor demand, policy and cost signals as early indicators of which pathway is becoming more prominent. These signals will help determine whether systems are moving toward faster decarbonization, more multidimensional trade‑offs, or greater divergence between advanced economies and EMDEs.