Featured Topics
Featured Products
Events
S&P Global Offerings
Featured Topics
Featured Products
Events
S&P Global Offerings
Featured Topics
Featured Products
Events
S&P Global Offerings
Featured Topics
Featured Products
Events
Language
Featured Products
Ratings & Benchmarks
By Topic
Market Insights
About S&P Global
Corporate Responsibility
Culture & Engagement
Featured Products
Ratings & Benchmarks
By Topic
Market Insights
About S&P Global
Corporate Responsibility
Culture & Engagement
S&P Dow Jones Indices — 9 Jul, 2020
By Bill Hao
The COVID-19 pandemic continues to create uncertainty in the global economy. The uncertain economic recovery and increased global corporate defaults have caused equity investors to turn to high-quality companies. The S&P Quality Developed Ex-U.S. LargeMidCap was designed to meet such needs. In this analysis, we investigate the performance, attributions, and characteristics of the index.
The S&P Quality Developed Ex-U.S. LargeMidCap has been outperforming its benchmark since its launch in July 2014. Up to June 30, 2020, the index had an annualized return of 5.0% (with an annualized volatility of 12.8%) against an annualized return of 2.4% (with an annualized volatility of 13.8%) from the S&P Developed Ex-U.S. LargeMidCap (the benchmark).
During the turbulent first half of 2020, the benchmark dropped about 10% (with an annualized volatility of 30.4%). In contrast, the S&P Quality Developed Ex-U.S. LargeMidCap outperformed its benchmark by 6.7% (with an annualized volatility of 28.8%; see Exhibit 1).

The S&P Quality Developed Ex-U.S. LargeMidCap selects its constituents based on three quality components:
Country Allocation
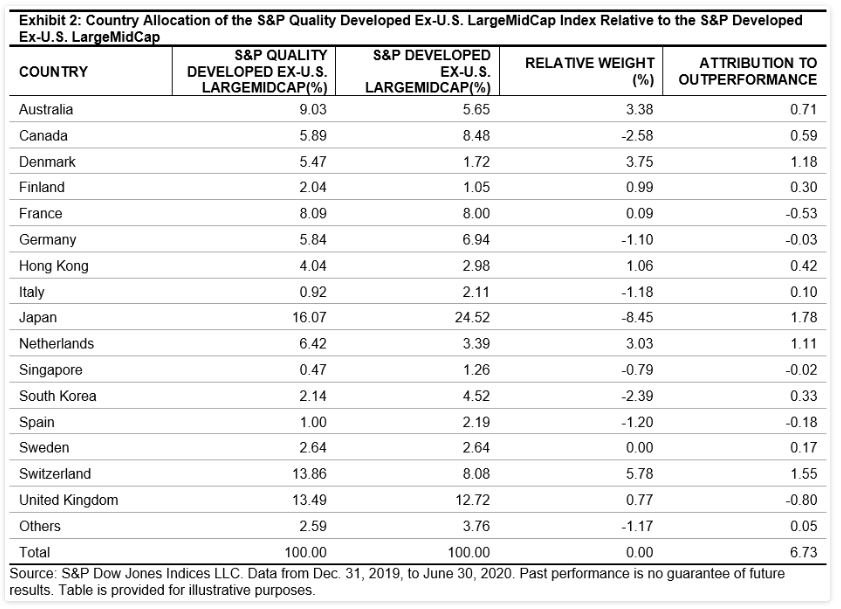
In Exhibit 2, we investigate the country allocation of the constituents in the S&P Quality Developed Ex-U.S. LargeMidCap and its benchmark. During the period studied, the index overweighted Switzerland (5.78%), Denmark (3.75%), and Australia (3.38%). Conversely, the index underweighted Japan (-8.45%), Canada (-2.58%), and South Korea (-2.39%). Over the six-month period, these large country weight differences contributed positively to the outperformance.

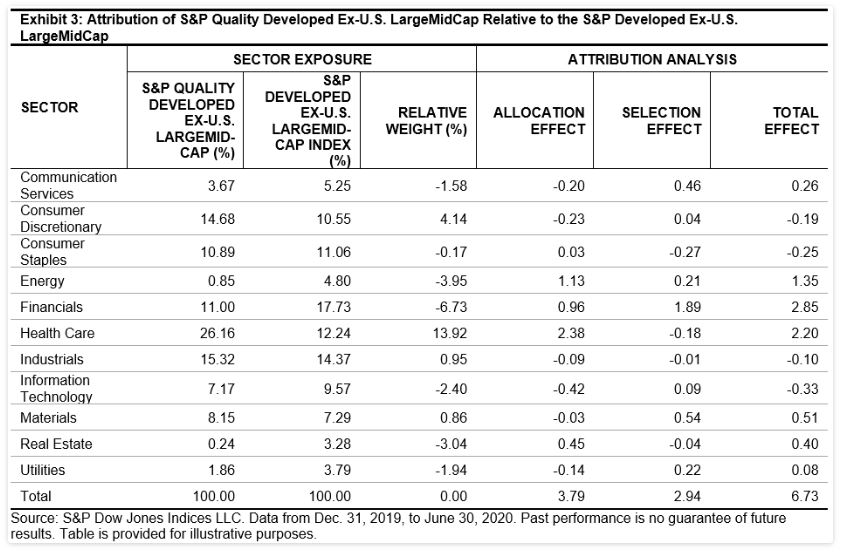
We next decompose excess returns of the S&P Quality Developed Ex-U.S. LargeMidCap into sector allocation and security selection of index constituents.
From Exhibit 3, we see the index was historically overweight in Health Care (13.92%) and Consumer Discretionary (4.14%). In contrast, it was underweight in Financials (-6.73%), Energy (-3.95%), and Real Estate (-3.04%) relative to its benchmark.
Among the total outperformance of 6.7%, more than half of that came from sector-allocation effects (3.79%) and the rest from constituent selection effect (2.94%). The results showed that the methodology of the S&P Quality Developed Ex-U.S. LargeMidCap added value through sector allocation and better-performing security selection during the period studied.

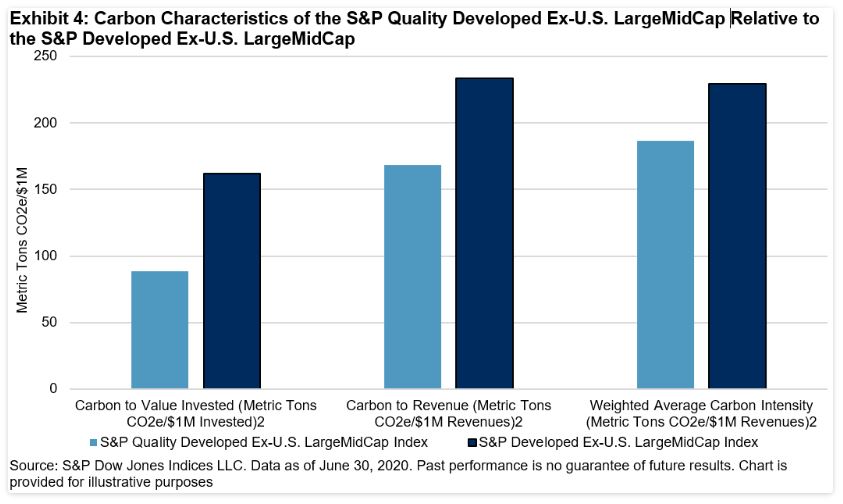
Besides its outperformance, the S&P Quality Developed Ex-U.S. LargeMidCap was also more carbon efficient[ii] than its benchmark, a positive feature for climate-conscious investors (see Exhibit 4).

In conclusion, the S&P Quality Developed Ex-U.S. LargeMidCap Index showed its merits over the long term and during this uncertain period. In addition, its carbon-efficient feature aligned with sustainability investing.
[i] The detailed factor definition and index construction are laid out in the S&P Quality Indices Methodology.
[ii] As measured by operational and first-tier supply chain greenhouse gas emissions. For more information, please visit www.spglobal.com/spdji/en/documents/additional-material/spdji-esg-carbon-metrics.pdf.
Content Type
Location
Segment
Language