Featured Topics
Featured Products
Events
S&P Global Offerings
Featured Topics
Featured Products
Events
S&P Global Offerings
Featured Topics
Featured Products
Events
S&P Global Offerings
Featured Topics
Featured Products
Events
Language
Featured Products
Ratings & Benchmarks
By Topic
Market Insights
About S&P Global
Corporate Responsibility
Culture & Engagement
Featured Products
Ratings & Benchmarks
By Topic
Market Insights
About S&P Global
Corporate Responsibility
Culture & Engagement
S&P Dow Jones Indices — 8 Apr, 2020
By Berlinda Liu
This article is reprinted from the Indexology blog of S&P Dow Jones Indices.
2019 was a remarkable year for risky assets. All benchmarks tracked in the SPIVA U.S. Year-End 2019 Scorecard delivered positive returns. Information Technology-heavy and more internationally diversified companies of the S&P 500® pushed the index to its second- and fourth-highest annual return since 2001 and 1990, respectively. In addition, the S&P MidCap 400® (26.2%) and S&P SmallCap 600® (22.8%) also delivered strong returns.
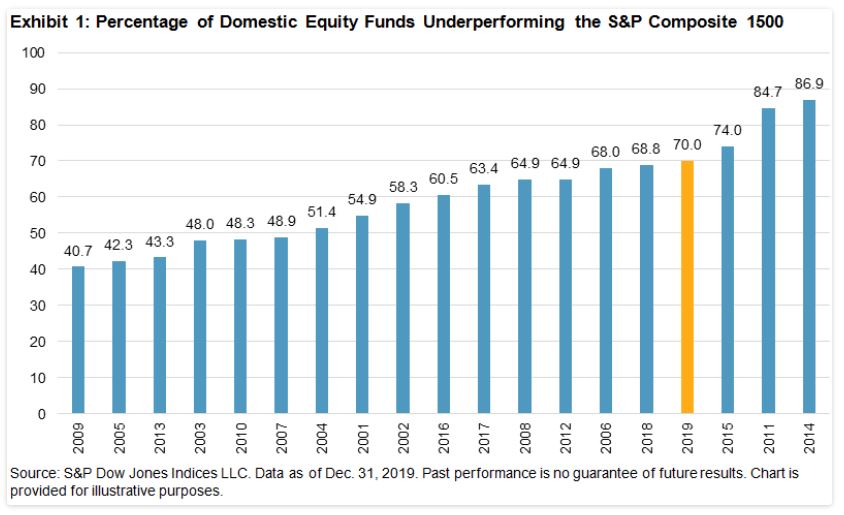
While these tailwinds helped U.S. equity managers, they still didn’t translate into active outperforming passive. Our latest SPIVA U.S. Scorecard shows that 70% of domestic equity funds lagged the S&P Composite 1500® over the one-year period ending Dec. 31, 2019. This is the fourth-worst performance since 2001.

Large-cap funds made it a clean sweep for the decade—for the 10th consecutive one-year period, the majority (71%) underperformed the S&P 500. Their consistency in failing to outperform when the Fed was on hold (2010-2015) or raising (2015-2018) or cutting (2019) rates deserves special note. Of the large-cap funds, 89% underperformed the S&P 500 over the past decade.
Mid-cap funds can claim some swagger when presenting to investment committees: 68% of mid-cap funds beat the S&P MidCap 400 in 2019, the third consecutive year the majority did so. Similarly, 62% of small-cap funds beat the S&P SmallCap 600. However, 84% of mid-cap funds and 89% of small-cap funds underperformed over the longer 10-year period.
However, one reason for the reasonably good performance of mid-/small-cap funds in 2019 could be performance divergence. In 2019, the S&P 500 outperformed the S&P MidCap 400 and S&P SmallCap 600. Arguably, mid-/small-cap managers could have outperformed their respective asset classes by shifting just a bit to larger caps; however, this strategy did not work in the long term because the three benchmarks showed much less divergence in the past 10 years.
In the past year, most value funds lagged their benchmarks across all market capitalizations. Over the past decade, however, we saw scant difference between growth and value funds’ likelihood of underperforming their benchmarks
As they say, the proof of the pudding is in the eating. If active managers cannot deliver outperformance over the long term, they should consider not remaining active!