Featured Topics
Featured Products
Events
S&P Global Offerings
Featured Topics
Featured Products
Events
S&P Global Offerings
Featured Topics
Featured Products
Events
S&P Global Offerings
Featured Topics
Featured Products
Events
Language
Featured Products
Ratings & Benchmarks
By Topic
Market Insights
About S&P Global
Corporate Responsibility
Culture & Engagement
Featured Products
Ratings & Benchmarks
By Topic
Market Insights
About S&P Global
Corporate Responsibility
Culture & Engagement
S&P Dow Jones Indices — 23 Oct, 2020
This article is reprinted from the Indexology blog of S&P Dow Jones Indices.
India has been one among many countries that favor a strong home bias in their investment portfolios. There have been many theories put forth on what causes the bias and research has been undertaken to understand it. Whether it is the ease of local information access, regulatory concerns, investor preferences, cost concerns, transactional viability, or cross-border risk aversion, the mystery remains unsolved. However, its prevalence is uncontroversial: academics and practitioners agree that Indian investment portfolios have in aggregate been stable at over 99% invested in domestic assets for decades. Even today, international allocations are only a rounding error away from zero.
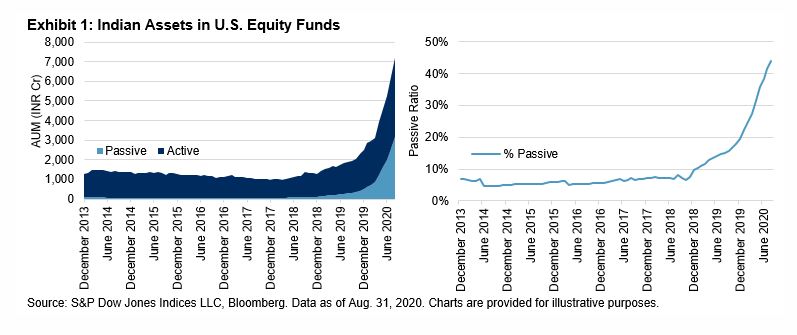
However, from that low base, Indian interest in global equities is on the rise—particularly when it comes to products accessing the world’s largest equity market: the U.S. Totaling more than INR 7,000 crores at the end of August 2020, the funds focused on U.S. equities have witnessed asset growth of over 400% in the past five years. Intriguingly, this growth has been supported—even led—by “passive” products (funds tracking an index), which have grown to represent over 40% of the total.

Meanwhile, although options for Indian investors are somewhat limited at present, the range of products available in the market is steadily on the rise. And against the backdrop of an INR 25.48 lakh crore mutual fund industry, there is plenty of room to grow—particularly if investors see the advantages of global diversification for balancing country risks and accessing returns.
International diversification does not have to be hard. The S&P 500®, one of the most widely used gauges for the U.S. equity market, has funds and other products tracking the index that are widely available across the globe. The index provides a simple option for diversifying country risk on a global scale: the S&P 500 represents over 50% of the global equity markets (as represented by the S&P Global BMI), while its performance versus the S&P BSE SENSEX over the past 34 years offers a clear illustration of its diversification potential.

Some may ask, isn’t index tracking settling for average performance? Not necessarily. In fact, the data points firmly in the opposite direction for large, liquid, and widely followed markets like the S&P 500. According to our SPIVA® U.S. Scorecards, a majority of active U.S. equity funds have underperformed the S&P 500 in 16 out of the 19 years since 2001.
In 2020, the performance of the U.S. stock market again emphasized its potential applications for Indian equity portfolios: YTD as of Oct. 12, 2020, the S&P 500 boasts a substantial 11% gain, despite the COVID-19 sell-off in March 2020, while the S&P BSE SENSEX has lost ground. For those Indian investors driving the trends of Exhibit 1, indices like the S&P 500 may have helped take participation up from zero to hero.

Note: Thanks to Tim Edwards for a series of conversations that generated ideas for this blog and for providing some of the accompanying data.
The posts on this blog are opinions, not advice. Please read our Disclaimers.
Content Type
Theme
Segment
Language