Featured Topics
Featured Products
Events
S&P Global Offerings
Featured Topics
Featured Products
Events
S&P Global Offerings
Featured Topics
Featured Products
Events
S&P Global Offerings
Featured Topics
Featured Products
Events
Language
Featured Products
Ratings & Benchmarks
By Topic
Market Insights
About S&P Global
Corporate Responsibility
Culture & Engagement
Featured Products
Ratings & Benchmarks
By Topic
Market Insights
About S&P Global
Corporate Responsibility
Culture & Engagement
S&P Dow Jones Indices — 19 May, 2020
By Fei Mei Chan
This article is reprinted from the Indexology blog of S&P Dow Jones Indices.
The world looks much different than it did three months ago. Since then equities hit their all-time peak, entered a bear market, exited a bear market, and currently sit 15% off peak with sustained higher volatility levels.
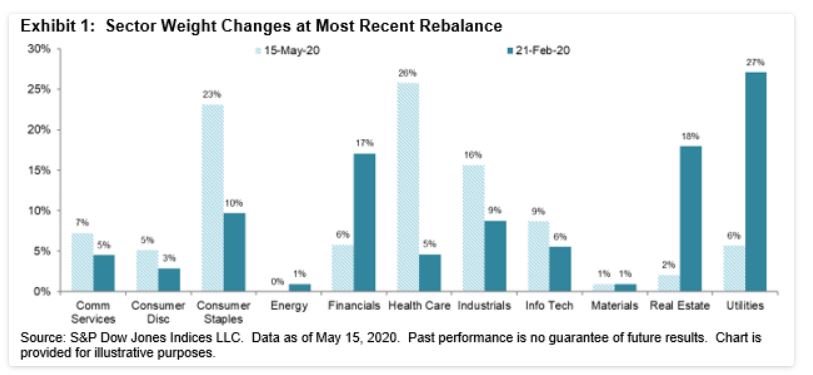
The latest rebalance for the S&P 500 Low Volatility Index®, effective after the close of trading today, rotated out 64 names in the index (63% in weight). For context, the median annual turnover for the last 28 years has been 64%. This quarter’s turnover is notable not just for its size, but also because of some large shifts in sectoral allocation, as shown in Exhibit 1. Low Vol’s weighting in Utilities fell by 21%, Real Estate by 16%, and Financials by 11%, while Health Care (+21%) and Consumer Staples (+13%) witnessed double-digit gains.

By design, Low Vol favors the least volatile sectors, with no arbitrary constraints. This latest rebalance is a good demonstration of how dynamic the index can be, and its size is a function of two things. First, all factor indices are subject to drift. They best embody the factors they’re designed to track immediately after they’re rebalanced. In periods of high dispersion, factor drift is especially likely, and dispersion in the S&P 500 hit near-record levels in March.
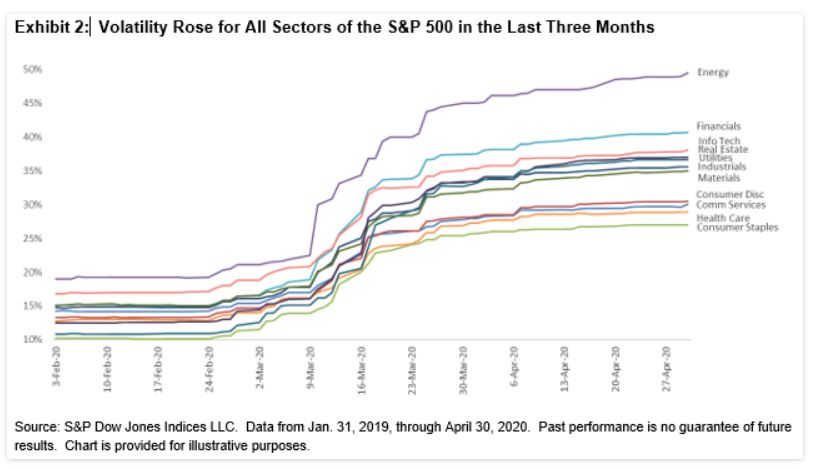
Second (and unsurprising in view of the level of dispersion), the volatility of the S&P 500 also spiked since Low Vol’s last rebalance. Importantly, although all sectors were more volatile, the increase was uneven. Exhibit 2 shows, e.g., that the increase in intra-sector volatility for Energy was especially dramatic, and that for Health Care and Consumer Staples more muted.

Content Type
Theme
Location
Language