
GTAS Forecasting
Formerly known as GTA Forecasting and World Trade Service
The world’s most comprehensive database of international trade and commercial freight traffic
The GTAS Forecasting provides market and business planners with in-depth analysis, historical data, and forecasts of bilateral trade between 248 countries and regions across 1362 HS4-level commodities and 16 key indicators (Trade Concepts), including containerized trade measured in container tons or TEU.
All trade flows in value and volume are broken down by transportation modes: Sea, Air and Overland/Other trade. Additional breakdown of Overland Transport into Rail, Road, Inland Waterway and Other is available for selected reporters, including EU member states (intra and extra EU trade) and additional countries: Bolivia, Botswana, Brazil, Chile, Colombia, Jordan, Mexico, Namibia, Peru, South Africa, South Korea, Switzerland, United Kingdom, and Vietnam.
It is a database including annual and quarterly frequency data updated every quarter.
Get the information and insight you need to size international markets, identify global business risks and opportunities, conduct strategic planning, make confident trade and transportation investment decisions, and secure long-term competitiveness.
- Plan competitive strategies by identifying when specific country and commodity trade will rebound
- Uncover risks and opportunities by analysing and comparing target markets
- Understand market trends and the economic factors driving them
- Understand factors that could impact economic development and infrastructure plans
- Conduct product line forecasting and benchmark performance

Empower Your Decision Making!
GTAS Forecasting supports your business needs across industries and around the world.
Benefits
- Consulting companies
- Trade associations
- Government agencies
- Logistics companies
- Ship owners and operators
- Commodity producers
- Port authorities
- Dredging and offshore contractor
- Shipyard constructors
How can the GTAS Forecasting help you?
GTAS Forecasting Features
-
Extensive historical database and forecasts
- Historical Database sourced in Global Trade Atlas
- Annual historical and forecast data ranging from 2005 to 2045
- Quarterly historical and forecast data ranging from 2020Q1 to 2025Q4
- All the historical values as well as forecasts are revised on a quarterly basis
- Bilateral trade between 248 countries and regions, across 270 commodities and 16 key indicators
- Historical data is carefully processed and standardised to consistently cover all countries across all commodity categories and indicators
- Missing data for Metric Tons is estimated
- Forecast is produced by commodity-specific and country-specific export and import global trade models
- A set of macroeconomic indicators from S&P Global Market Intelligence, Economics & Country Risk division are input into the forecasting model
- The simultaneous modeling of all time-series using three different statistical methods to select the best-suited model results
-
Easy access to data, analysis and visualizations
- Access GTAS Forecasting data via Data Browser on Connect platform, our user-friendly, web-based interface
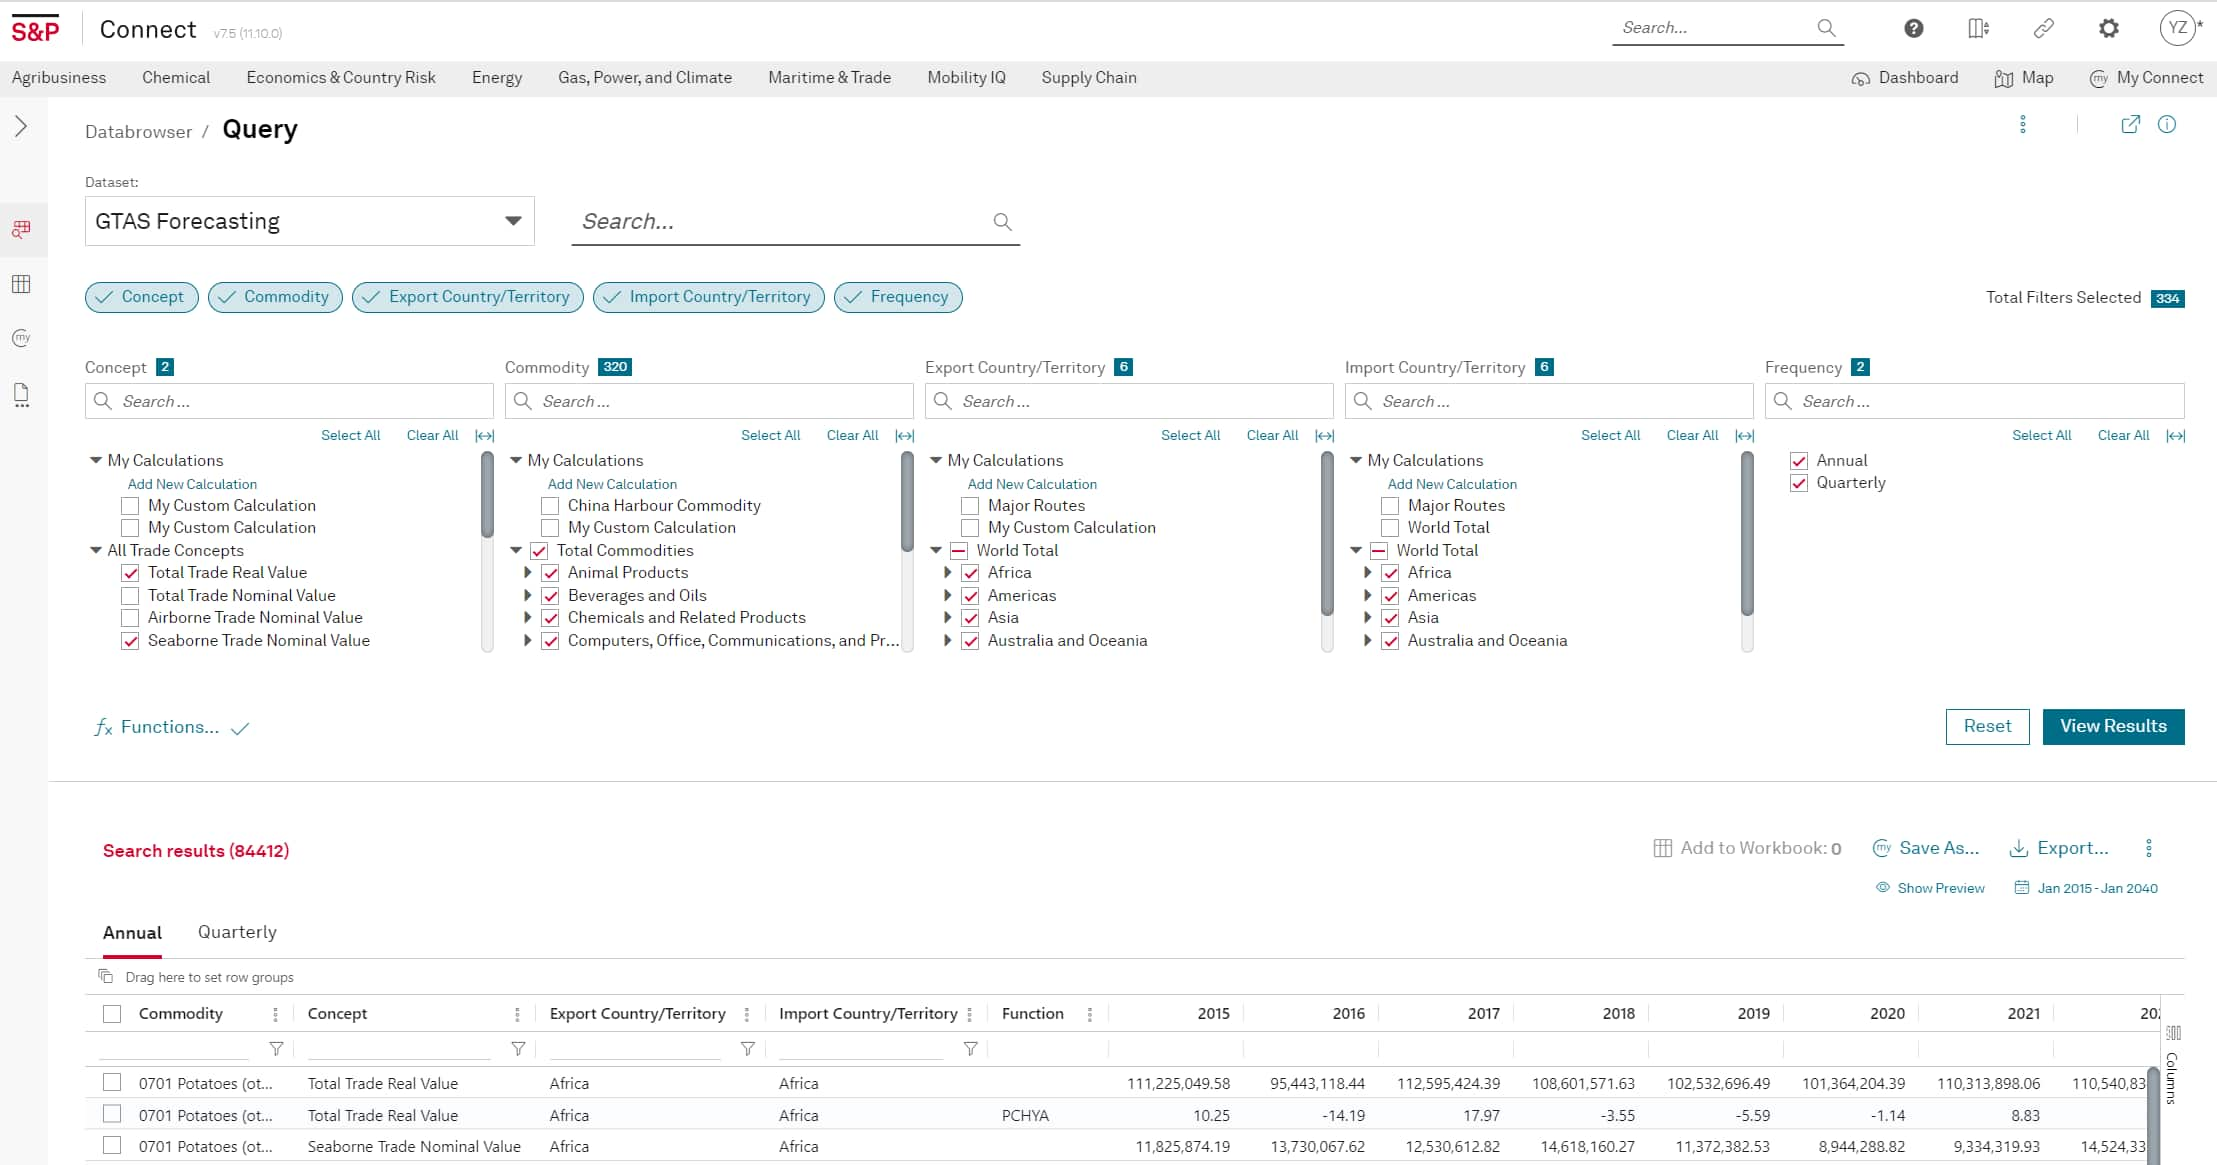
- Select countries, commodities and indicators; create your own customized regional and commodity aggregates and download your data in Excel format
- Use our GTAS Forecasting dashboard with trade visualizations, methodology documents, service bulletins and macroeconomic drivers
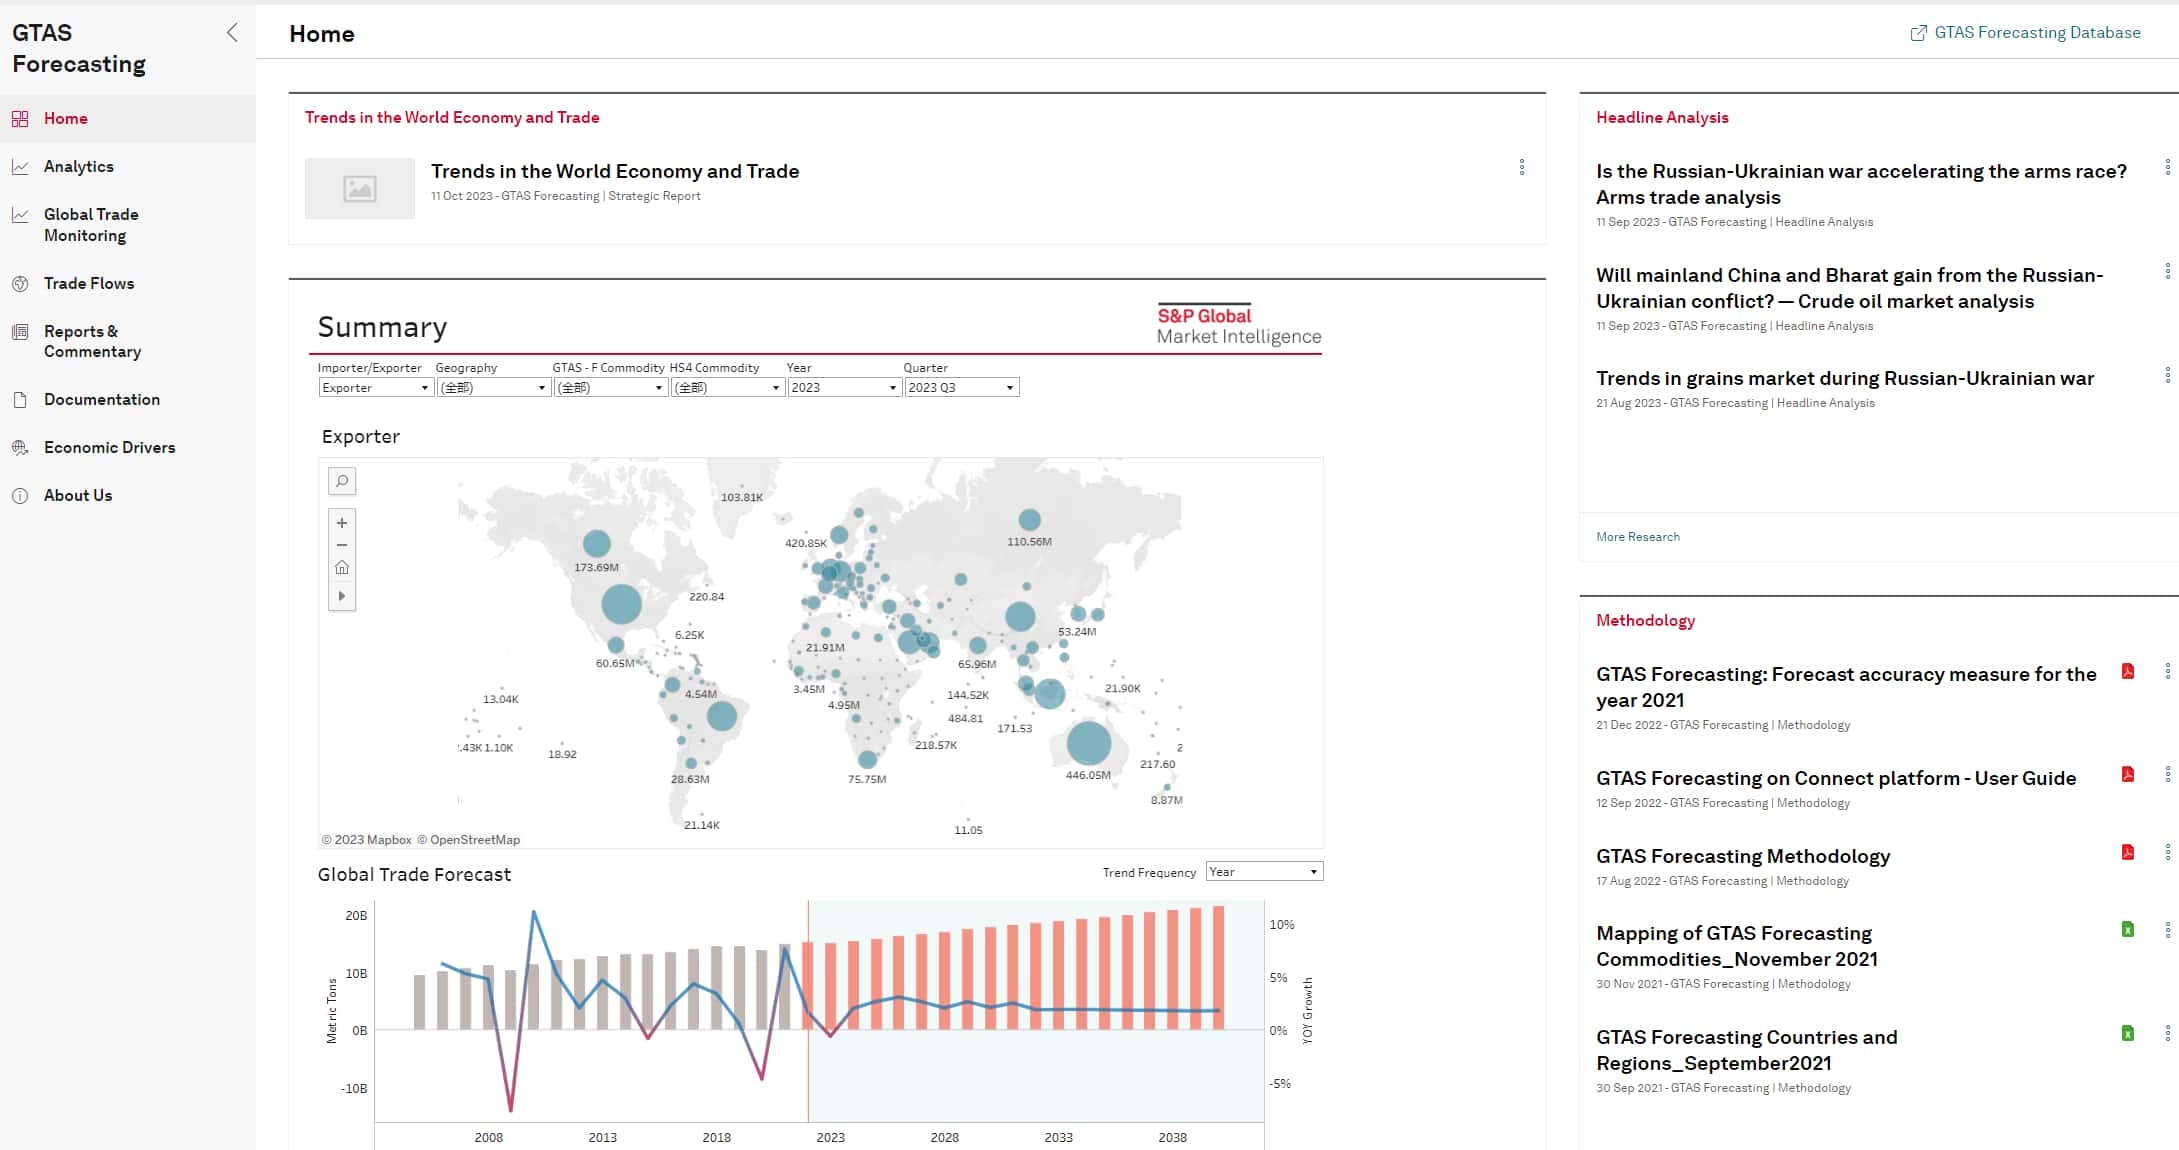
GTAS Forecasting dashboard
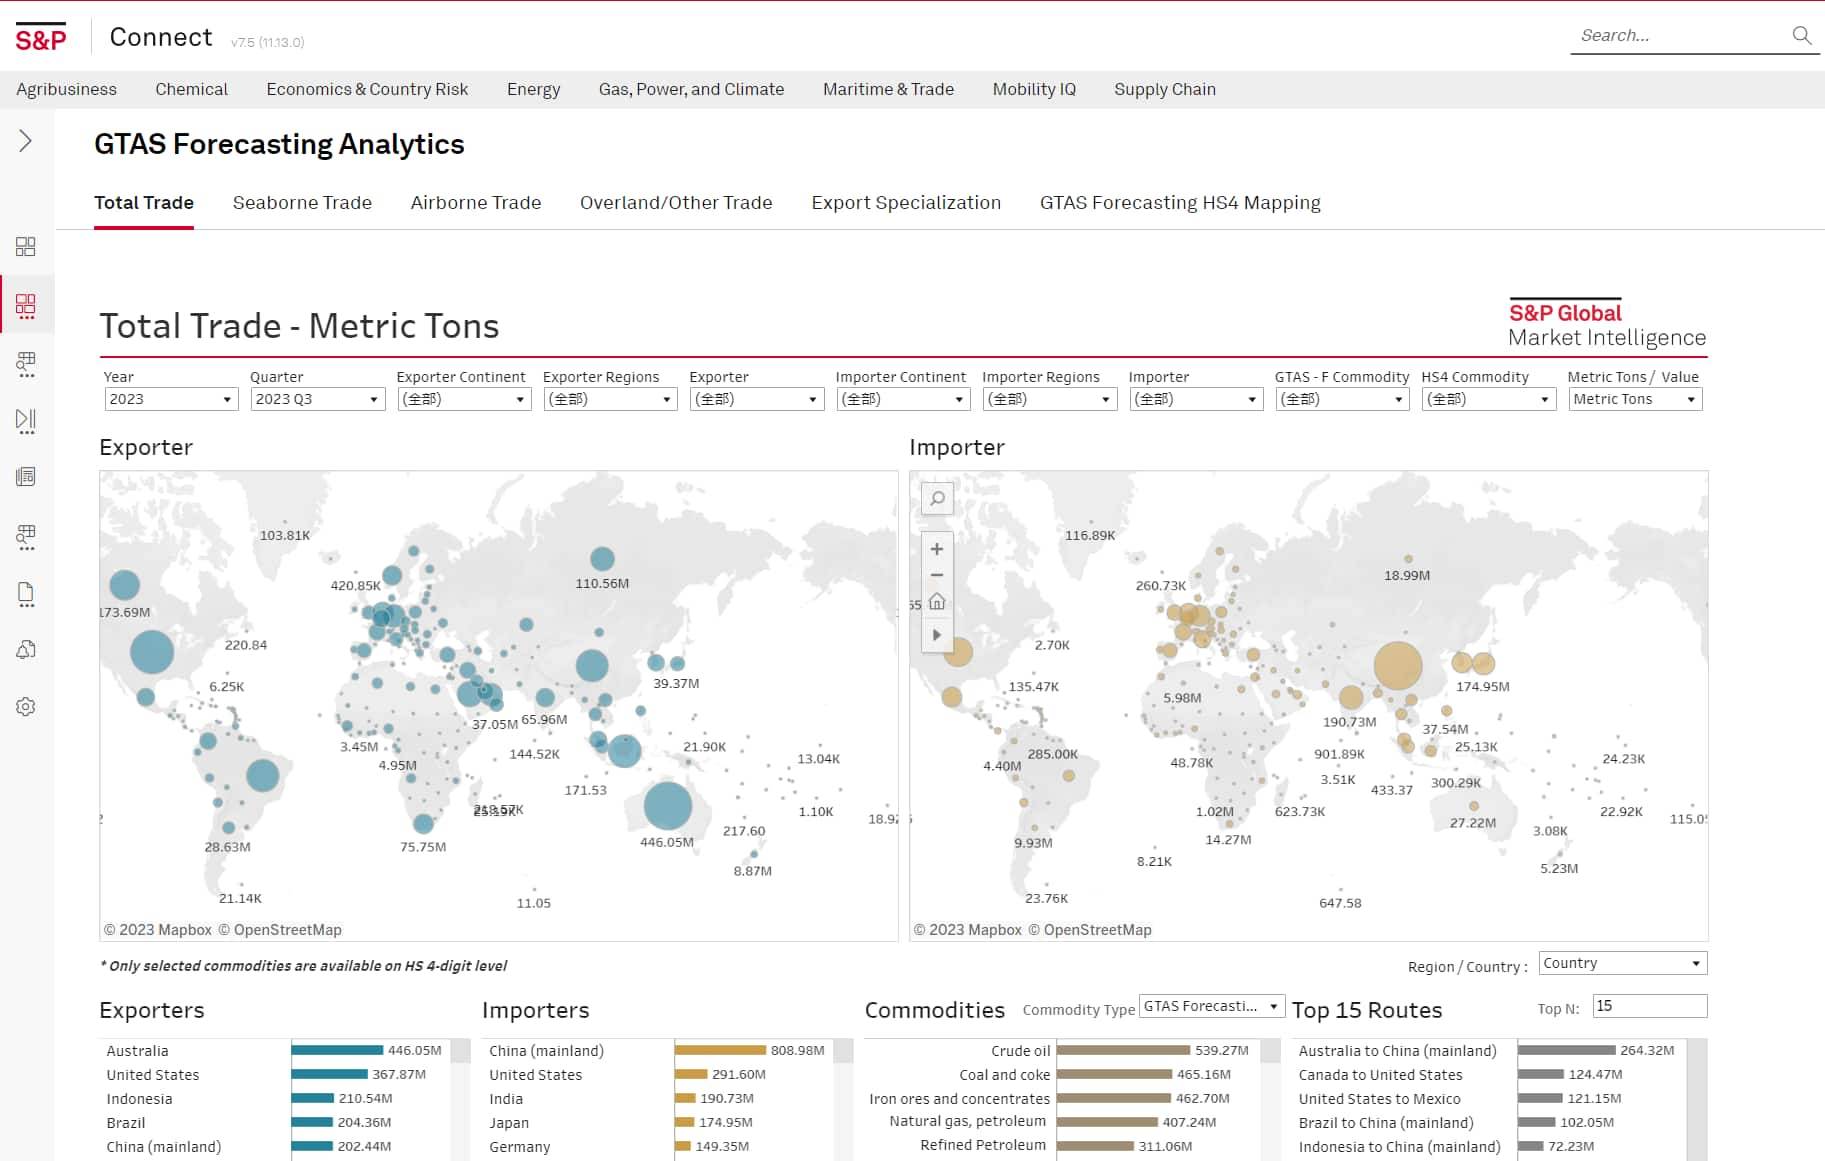
- Use our new GTAS Forecasting Analytics with trade data by transportation modes displayed on interactive maps, charts and rankings of top exporters/importers and trade routes
-
Analysis and commentary
- Trends in the World Economy and Trade - quarterly report providing an overview of trade and transportation trends and outlooks focusing on global trade by export and import regions and by transportation mode, seaborne and containerized trade outlook, comparison with our previous forecast as well as the world economy and commodity prices sections
- Exclusive Insights and Headline Analysis on global trade focusing on international trade relations, along with trade regulatory issues
- Read our latest Global Trade Outlook for 2023
Supply Chain Research & Analysis
Request Follow Up
You're one step closer to unlocking our suite of financial information solutions and services.
Fill out the form so we can connect you to the right person.
We're proud of our recent awards!
- Best Managed Data Service Provider, 2025
- Best Private Markets Data Provider, 2025
- Most Innovative use of Generative AI, 2025
- Service Provider of the Year, 2025
And, we delight in supporting our customers with 24x7x365 customer service and a 98% customer service satisfaction rate.
If your company has a current subscription with S&P Global Market Intelligence, you can register as a new user for access to the platform(s) covered by your license at S&P Capital IQ Pro or S&P Capital IQ.
Prefer to reach us by phone? Call us at +1-800-786-8980 and we'll connect you to the right expert.