
ChartIQ: Financial Charting & Data Visualization
Enterprise charting SDK from S&P Global Market Intelligence—interactive, multi-chart workspaces for real-time market and financial data analysis platforms.
Powerful Data Visualizations Designed for Finance
ChartIQ is a data visualization and charting engine built for financial institutions and trading platforms. Embedded within client-facing and internal applications, it allows users to explore complex datasets, uncover relationships across multiple data sources, and transform raw information into clear, actionable insights.


Differentiate Your Platform
ChartIQ’s graphic technology helps organizations define and differentiate their brand. Our JavaScript graphics library is designed to be embedded within an internal- or external-facing application, helping attract and engage users across web, mobile, and desktop environments. The platform’s data-agnostic architecture allows integration with both internal and external data sources, empowering users to draw new connections by blending diverse content sets.
Attract Users with AI-Optimized Data Visualization Workflows
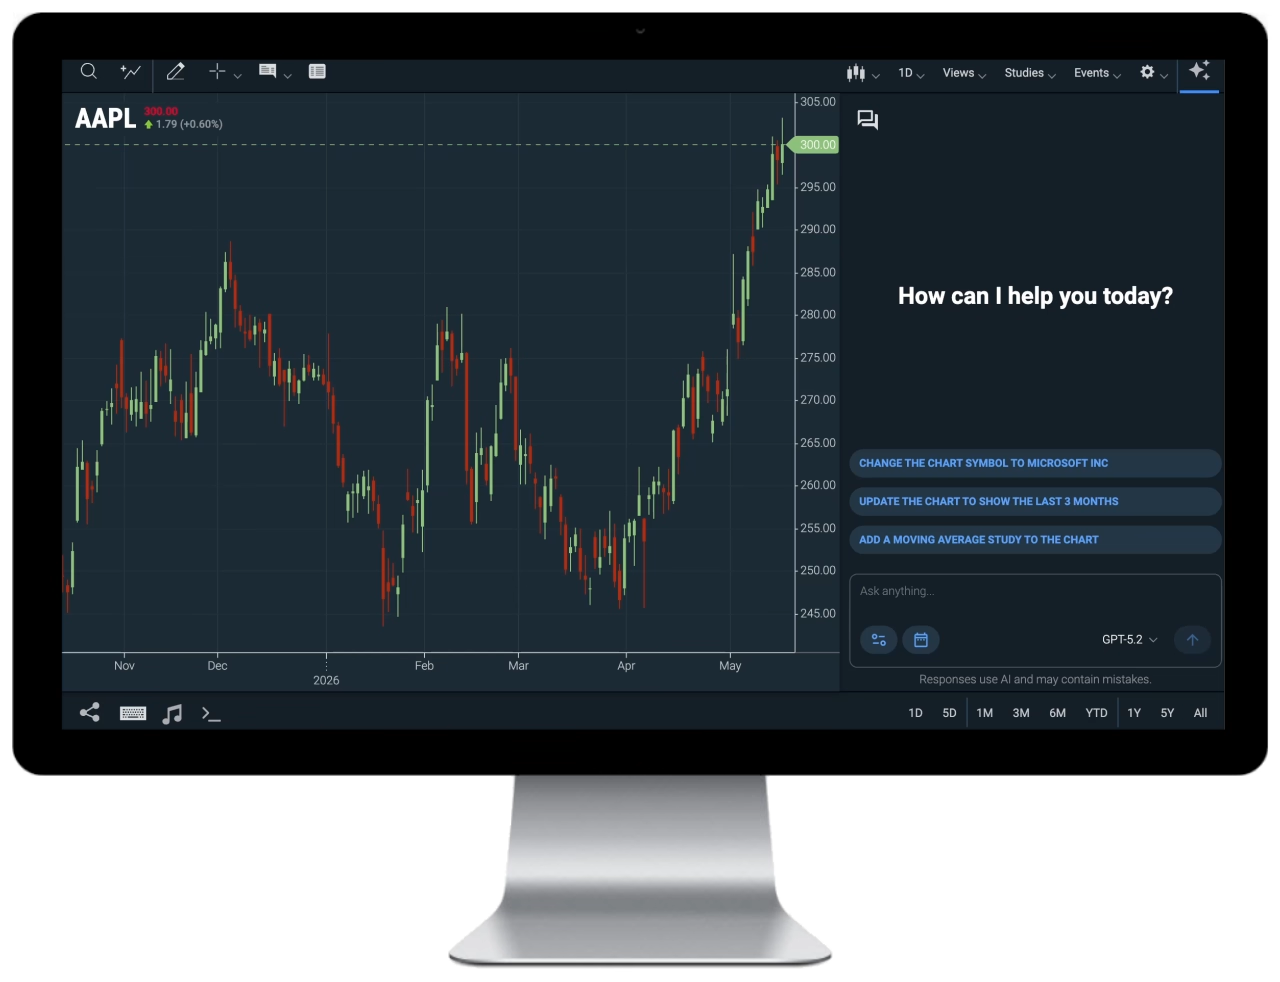
AI is transforming financial market analysis, making insights faster, more accessible, and more intuitive. ChartIQ brings this intelligence directly into the charting environment, turning raw data into faster, clearer, and more actionable insights. With AI-powered plugins and AI-ready charting, market participants can use natural language to explore data from any source, surface key market events through AI-generated summaries, and interpret technical indicators with greater clarity and speed.

Flexibility for a Wide Range of Applications
Being entirely data agnostic, ChartIQ’s graphic use cases include solutions for buy- and sell-side users, ranging from front-office traders, analysts, and portfolio managers to back-office compliance and surveillance teams. ChartIQ's data visualizations focus on time series and cross-sectional plots, helping users understand an array of related instruments at a moment in time.
Maintain Brand, Design, and UX/UI Consistency
Deliver a solution that aligns with your brand and UX standards while accelerating time to market with a comprehensive software development kit (SDK) that includes APIs, interface templates, sample implementations, and add-on modules. The library is built in pure JavaScript and includes highly customizable UI components. It integrates seamlessly with browser-based applications across leading frameworks, including React and Angular, without compromising brand integrity or relying on third-party elements. Mobile and desktop-native applications can leverage the same SDK to deliver the high-quality interactive charting users expect, while maintaining visual consistency across platforms.

Elevate Your Application With Visual Analytics
Move Beyond Traditional Charts to Uncover Actionable Insights

The ChartIQ Difference for the Buy and Sell Side
ChartIQ is a professional-grade white-label JavaScript Charting Library that works seamlessly within any application and on any platform or framework using a single library.
Satisfy Traders On-the-Go
ChartIQ’s mobile version features everything users depend on within your application, optimized for mobile form factor and speed.
Utilize A Robust Software Development Kit (SDK)
ChartIQ is an infrastructure toolkit, carefully thought through and built to provide unparalleled flexibility, while maintaining ease of integration.
Integrate Your Data >
ChartIQ can render data from any feed, vendor, or API end-point, simplifying data access for the user, helping them see relationships within the data.
Build Your Own ChartIQ >
ChartIQ’s modular architecture gives users what they need to succeed, including premium modules, such as Active Trader and CrossPlot.
ChartIQ Accessibility >
ChartIQ is designed for all users and is WCAG 2 compliant with features including tab navigation, keyboard shortcuts, and screen reader support, and Chart2Music.
Discover the Power of ChartIQ for Your Workflow


-
Buy-Side
-
Sell-Side
-
Corporations
Blend your proprietary content, including trade data, with financial and market data in a single, unified graph that brings visual clarity and insight to the investment process.
ChartIQ’s embedded charting technology transforms complex market data into intuitive visual insights, giving traders, analysts, and portfolio managers the context to monitor performance, spot opportunities, and act decisively in fast-moving markets. Its flexible interface fits seamlessly into team workflows, helping turn information into actionable decisions.
-
Major Banks
Major Banks
How a Major Bank Expanded Its Online Brokerage with an Innovative Charting Experience
A major Canadian bank enhanced its self-directed brokerage platform by integrating ChartIQ’s HTML5 charting library, enabling rapid deployment of customizable, interactive visualizations that support web, mobile, and cross-platform use.
-
Market Data & Research Firms
Market Data & Research Firms
Information Provider Upgrades Charting Technology with Enhanced Interface and Mobile Compatibility
A leading information provider enhanced its charting capabilities by adopting a sleek, modern interface and mobile compatibility. This upgrade empowered users with intuitive, on-the-go analytics, significantly improving their decision-making experience.
Deliver best-in-class visual analytics that provide insight and transparency to the trading process, strengthening client engagement.
With ChartIQ integrated into client-facing and internal solutions, teams can blend an array of content to interpret market activity and client behavior with confidence, driving smarter execution and stronger relationships. It supports decision-making across trading, product, and compliance workflows, helping sell-side firms differentiate their platforms and deliver measurable impact.
-
Options Platforms
Options Platforms
Premier Options Platform Attracts New Users with Advanced Charting Tools
By introducing advanced charting tools, a premier options platform made analyzing complex data faster and more intuitive. These enhancements helped attract new users and support more informed trading decisions.
-
Trading Platforms
Trading Platforms
State of the Art Visualizations Transform a Trading Platform’s User Experience
A leading trading platform transformed its user experience by integrating state-of-the-art visualizations that deliver high-performance charting capabilities. This enhancement empowered traders with intuitive, data-rich interfaces, enabling more informed and efficient decision-making
Elevate your platform and brand impact with a differentiated charting experience that drives engagement and helps users better understand financial markets.
Whether building fintech apps, compliance platforms, or media products, success depends on delivering tools that drive engagement and help users turn raw data into meaningful visualizations. Integrating ChartIQ’s time series charting engine allows platform providers full customization of the user experience, making it easier to communicate trends, monitor key activity, and create differentiated user experiences that drive product value.
-
Compliance Platform Providers
Compliance Platform Providers
Compliance Platform Provider Enhances Its Offering with State-of-the-Art Charting
By integrating state-of-the-art charting tools, this compliance platform provider enhanced how users visualize and analyze data. The upgraded functionality enables compliance professionals to monitor activity more effectively and make faster, more informed decisions.
-
Media/Publishing
Media/Publishing
A Financial Media Firm Enhances Its Platform with a Charting Solution that Brings Data to Life
With a refreshed interface and mobile compatibility, this information provider brought greater flexibility and usability to its charting tools. Users gain faster access to insights, making analysis and decision-making more seamless
-
Fintech Platforms
Fintech Platforms
India-based Fintech Firm Scales its Low-Latency Streaming Solution with High-Powered Charting
By integrating high-powered charting, this India-based fintech firm scaled its low-latency streaming solution to deliver faster, more actionable insights. Users can now visualize real-time data more effectively, improving responsiveness and decision-making
-
Financial Data Providers
Financial Data Providers
Financial Data Provider Strengthens Its Platform with Advanced Visualizations
Enhancing its platform with advanced visualization capabilities, this financial data provider made complex information more accessible and actionable. Users can now explore and analyze data with greater clarity and confidence.
Frequently Asked Questions (FAQs)
ChartIQ Blogs and Analysis
Request Follow Up
You're one step closer to unlocking our suite of financial information solutions and services.
Fill out the form so we can connect you to the right person.
We're proud of our recent awards!
- Best Managed Data Service Provider, 2025
- Best Private Markets Data Provider, 2025
- Most Innovative use of Generative AI, 2025
- Service Provider of the Year, 2025
And, we delight in supporting our customers with 24x7x365 customer service and a 98% customer service satisfaction rate.
If your company has a current subscription with S&P Global Market Intelligence, you can register as a new user for access to the platform(s) covered by your license at S&P Capital IQ Pro or S&P Capital IQ.
Prefer to reach us by phone? Call us at +1-800-786-8980 and we'll connect you to the right expert.