


Research — JULY 30, 2025
Corporate-signed US clean energy surpasses 130 GW amid shifting policy support
By Adam Wilson and Tony Lenoir
Corporate offtakers contracted over 11.5 GW of US clean energy in the roughly five-month period since our February 2025 update, with Amazon.com Inc., Meta Platforms Inc. and Microsoft Corp. driving more than 76% of the activity. The nearly 10% rise in tracked volume during the interval suggests that corporate demand for carbon-free electricity remains elevated amid shifting energy priorities in President Donald Trump's second term. However, this could evolve with the passage of Trump's budget bill, also known as the One Big Beautiful Bill Act.
Signed into law by Trump on July 4, 2025, the budget legislation notably slashes federal support for the deployment of renewable energy, with the accelerated phaseout of key 30% investment and production tax credits from the Inflation Reduction Act of 2022. That said, solar and wind projects coming online by Dec. 31, 2027, or beginning construction by July 4, 2026, will qualify for the full credits — a wrinkle in the law that could result in a renewable capacity boom over the next couple of years.

Corporate clean energy procurement maintained solid momentum during the first few months of Trump's second term in office, despite all the chatter around the new administration having a new US energy focus.
However, our latest tracking interval stopped at June 30, 2025 — four days before the signing of the One Big Beautiful Bill, which takes an ax to the renewable energy incentives from the Biden administration's Inflation Reduction Act. Still, the law's tax credit phaseout timeline and its language around eligibility suggest a solar and wind energy boom could occur in the next two years.
Meanwhile, any examination of US geography highlights Texas' attractiveness to corporate offtakers. Primarily associated with fossil fuels in the public consciousness and without renewable or clean energy standards, the state nonetheless leads the US in renewable deployment, illustrating a path to renewable energy viability outside of broad mandates and policy incentives.

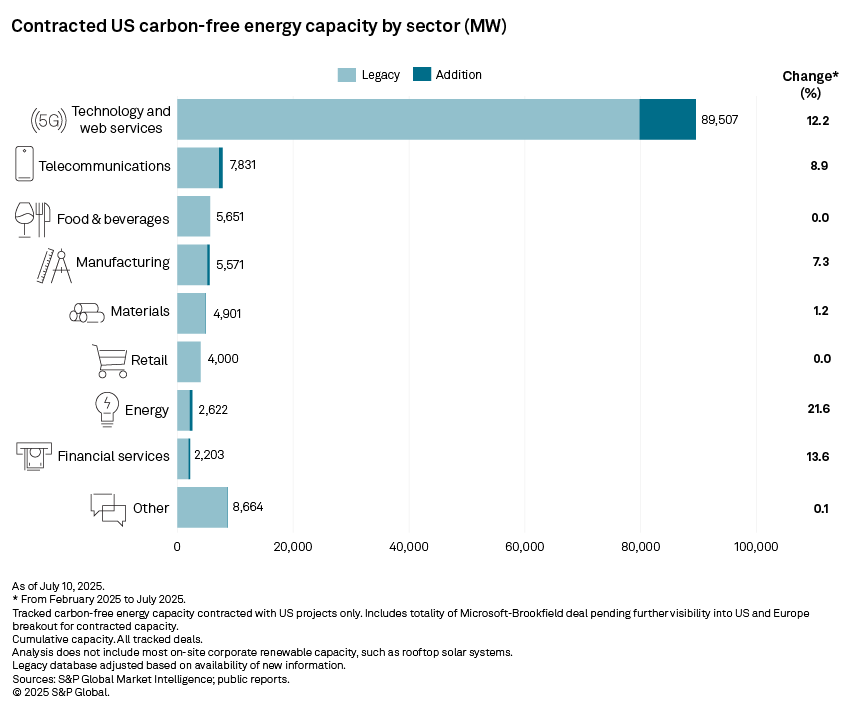
Overall, the technology and web services sector accounted for more than 84% of tracked US clean energy procurement for the period under consideration, with 9.7 GW of contracted capacity, including 7 GW of solar, 1.4 GW of wind and 1.3 GW of nuclear. The volume and variety of the contracted capacity underscore the sector's enormous power needs amid the AI revolution (and associated datacenter boom) and the electricity diversification strategy — of which nuclear is now an integral part — increasingly embraced by Big Tech.
Download data details in Excel.
The technology and web services sector possesses an unmatched combination of aggressive clean energy goals and unrivaled energy demand growth due to the rising need for power-hungry AI datacenters. As a result, the segment continues to increase its dominant share of the corporate clean energy market, rising from 59% in the February 2023 update to 62% in the 2024 update to 68% currently.
The telecommunications sector remains a distant second, making up just 6% of the market after adding less than 700 MW in this update. The energy segment — which includes (somewhat ironically) mostly oil and gas companies — increased 21%, the largest percentage increase over the last six months, but overall accounts for just 2% of corporate procurement. Financial services grew 14% after adding 264 MW in this update. Growth in the remaining sectors was generally stagnant.
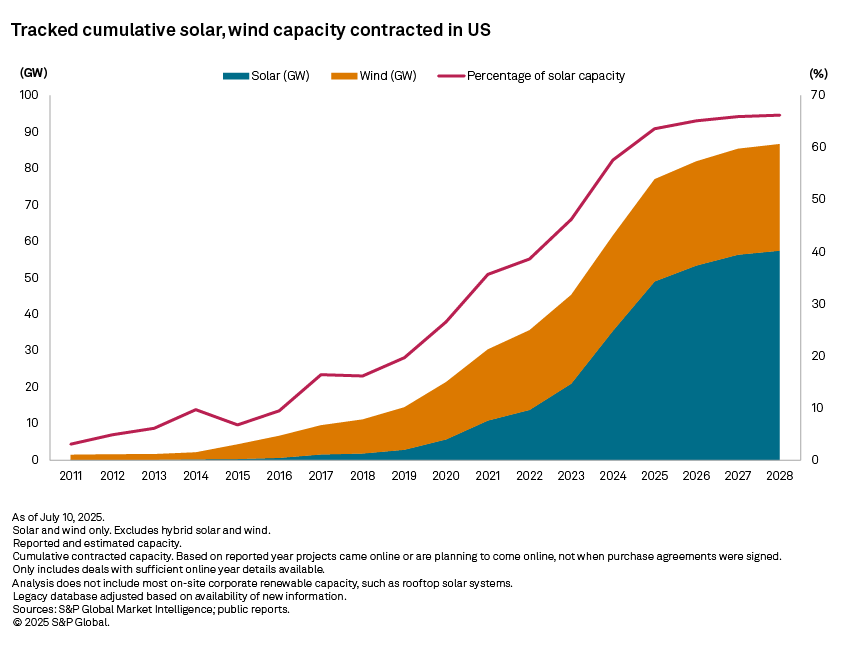
Solar continues to dominate corporate clean energy deals, with 7.9 GW of photovoltaic capacity contracts signed in the US since the February update. Wind capacity accounted for 2.3 GW of US-based corporate procurement, with nuclear continuing to gain momentum, adding another 1.3 GW. Internationally, US-based corporations signed an additional 2.8 GW of solar capacity and 1.2 GW of wind capacity. To date, nuclear deals with corporate offtakers have not been tracked outside the US.
Based on online date, solar capacity committed to non-utility offtakers surpassed wind in 2024, constituting nearly 58% of corporate deals in the US. By the end of 2025, this share is expected to jump to 64% before settling at about two-thirds of US corporate procurement by 2028. Note that some megawatt capacity figures are estimated based on comparable capacity factors in cases where deals are reported in megawatt-hours.
Over 22 GW of nuclear capacity is tied to corporate offtakers — all of them in the technology and web services sector. Most of this capacity is in projects that have yet to break ground, with tentative online dates expected at the end of the decade or beyond. Over half of this nuclear capacity is from the Master Power Agreement signed between Oklo Inc. and datacenter company Switch Inc., which is expected to be completed across several phases, with completion not expected until 2044. Geothermal deals have also popped up, with Meta, Microsoft and Alphabet Inc. subsidiary Google LLC announcing agreements recently. However, at just 326 MW total, geothermal has yet to be established as a widely viable technology for corporate procurement.
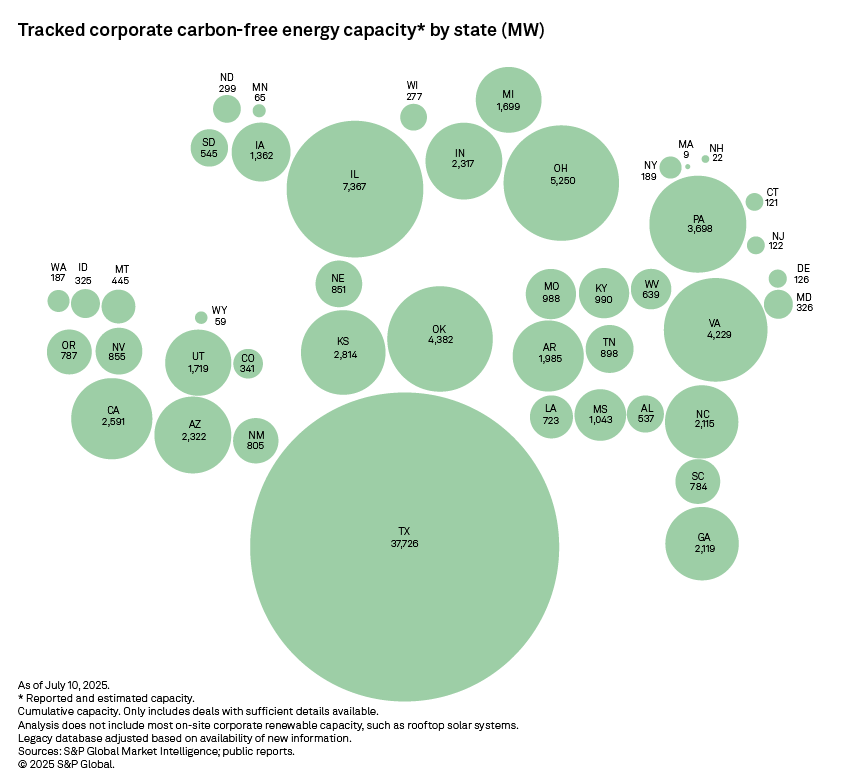
By location, corporate deals in the US, once again, heavily favored Texas, where 4.8 GW of clean energy deals were signed since the February update. Texas now has as much corporate-tied wind and solar capacity as the next 10 states combined and accounts for 39% of the US aggregate. Illinois tightened its grip on the second-place spot, adding 1.5 GW since February, compared to just 0.2 GW for third-ranked Ohio. Pennsylvania leaped ahead of Kansas to take sixth place after adding 1.2 GW of corporate clean energy capacity — the third highest in this update.
Outside the US, US-based companies in the technology and web services sector were active in Europe, adding a tracked 2.4 GW across the continent, with other sectors contributing just 0.3 GW of clean energy deals. Amazon led, adding 1.7 GW of wind and solar deals, mainly in Italy and Spain. In total, contracts for nearly 1.6 GW of clean energy — mostly in the form of solar power — were signed in Spain and Italy since February.
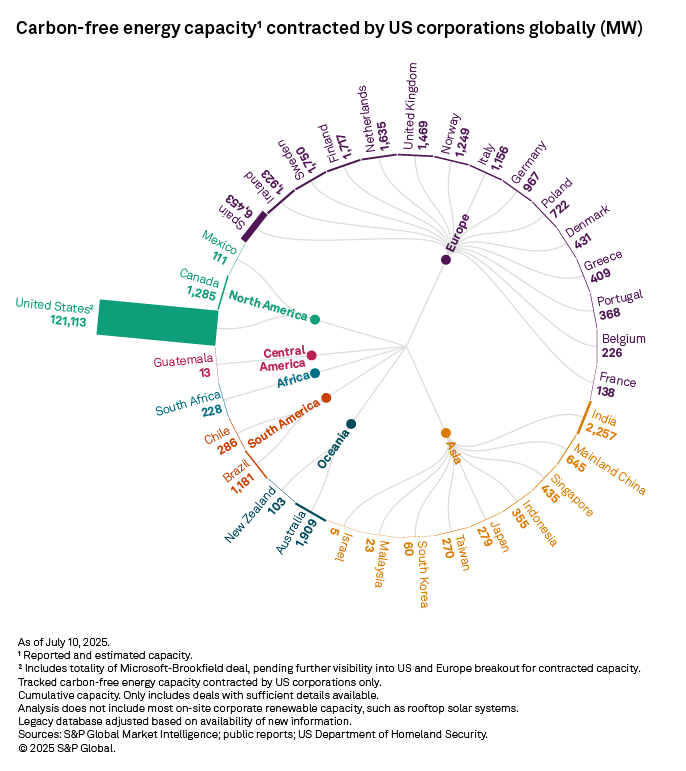
Outside of the US and Europe, corporate procurement activity from US-based companies was relatively low in the five months since February 2025. In Asia, 357 MW of clean energy was signed, led by India and Indonesia. In South America and Central America, only Brazil added to its corporate procurement tally, with Dow Inc. signing the largest deal for 330 MW of solar energy. Australia added 454 MW in this update, with roughly half coming from three Amazon deals; mining company Newmont Corp. was the counterparty for the remaining capacity.
Cumulatively, US corporations had contracted over 151 GW of clean energy globally as of our July 2025 update. Clean energy contracted with US-based power plants has a clear lead, accounting for at least 73% of the total if the Microsoft-Brookfield Renewable Corp. deal for 10.5 GW of carbon-free power across the US and Europe is excluded. The exact split across the two continents has not been disclosed, and attributing the totality of the Microsoft-Brookfield deal to US projects brings the figure to 80%.
Contracted Europe-based, CO2-free capacity — spread across 15 different markets — is far behind, with its share ranging from 13.6% to 20.6%, depending on how the Microsoft-Brookfield deal is treated. Spain and its sunny latitudes are particularly prized by US corporate offtakers, notably Big Tech, with clean energy capacity contracted by US companies in the country coming in at 6.5 GW as of our latest update — 31.3% of the European total.
This update — for which data was collected through July 10 — does not include the deal between Google and Brookfield Renewable announced on July 15 for 670 MW of hydropower in Pennsylvania under a framework agreement to procure up to 3 GW.
For wholesale prices and supply and demand projections, see the S&P Global Market Intelligence Power Forecast.For a complete, searchable listing of RRA's in-depth research and analysis, please go to the S&P Capital IQ Pro Energy Research Library.
This article was published by S&P Global Market Intelligence and not by S&P Global Ratings, which is a separately managed division of S&P Global.
Data visualization by Shirley Gil.
S&P Global Commodity Insights produces content for distribution on S&P Capital IQ Pro.
Theme
Location
Products & Offerings
Segment