Research — Nov 19, 2026
US export coal rallies on European demand

By Steve Piper
Coal prices were mixed during October, with Central Appalachian export benchmarks higher and Northern Appalachian lower, while export demand stayed supportive. The Energy Information Administration's (EIA's) October Short-Term Energy Outlook projects 2026 US coal exports at 102.4 million short tons, up 10.6% from 92.6 million st in 2025, yet overall volumes are expected to fall as domestic thermal demand remains in tight competition with gas. Elevated coal stockpiles may further limit demand going into 2027. Export growth during the first half of 2026 has been driven mainly by a recovery in global metallurgical coal markets, but October's rally suggests high LNG prices in Europe may be adding support.
On the US domestic front, gas remains competitively priced for generation in regions with coal plants, with firmer gas prices mainly centered on the US Gulf Coast. Combined with high coal stockpiles, we forecast constrained coal production through 2027. Although gas prices are expected to normalize after 2027, the US coal market will face renewed pressure from the expansion of solar and wind generation in regions with supportive economics and supportive state policies. The S&P Global Market Indicative Power Forecast also projects coal plant retirements and reduced utilization through 2035, with 43.5 gigawatts of coal plants forecast to retire. Coal plant generation share is forecast to decline to 7.1% through 2035, down from 15.3% of total generation in 2027.

➤ US export coal prices rallied in October, with Atlantic Basin benchmarks seeing the largest increases.
➤ Elevated domestic coal inventories and competitive natural gas remain likely to result in declining aggregate production in 2026, with Powder River Basin coal showing the largest declines compared to 2025.
➤ In the longer term, S&P Global Market Indicative Power Forecast projects 43.5 GW of coal plant retirements by 2035, driving coal's share of total generation down to 7.1%.

Coal benchmark prices were mixed through October. Coal stockpiles remained high, constraining domestic prices. Central Appalachian benchmarks rose the most, with the CAPP 12,500 British thermal unit per pound, 1.5 lb SO2 CSX benchmark up $4.00/st to $88.00/st (4.8%), NYMEX CAPP look-alike also up $4.00/st to $85.00/st (4.9%), and the Thacker 12,500 Btu/lb NS benchmark up $4.00/st to $89.00/st (4.7%). In contrast, the NAPP Pittsburgh Seam 13,000 Btu/lb benchmark fell $4.00/st to $68.00/st (5.6%). Domestic coal benchmark prices were little changed, with Illinois Basin 11,500 mid-sulfur gaining $0.50/st to $55.25/st (0.9%), while the NYMEX Powder River Basin benchmark held at $14.65/st.
Henry Hub spot prices opened October at $3.02/million Btu and eased to close at $2.68/MMBtu on Oct. 30. Spot prices averaged $3.01/MMBtu for the month, up from $2.94/MMBtu in September. Working gas in storage was 3,801 billion cubic feet as of Oct. 10, 54 Bcf above the five-year average and 109 Bcf below the same week of 2025.
Regional discounts to Henry Hub widened in the Midwest and Northeast. Chicago Gate averaged $2.56/MMBtu, a $0.46/MMBtu discount to Henry Hub. TCO Pool's discount widened to $1.64/MMBtu, with a monthly average of $1.37/MMBtu, while TETCO M3 moved to a discount of $1.73/MMBtu, with a monthly average of $1.28/MMBtu. SoCal Border held near parity with Henry Hub, averaging $2.90/MMBtu during the month, an $0.11/MMBtu discount.
EIA data shows power-sector coal stockpiles at 108.8 million st in July, down from 118.3 million st in June. The EIA's October outlook puts end-September stockpiles near 100 million st, against about 105 million a year earlier. The drawdown from the summer cooling season has been modest, indicating continued robust inventories through the end of 2026.
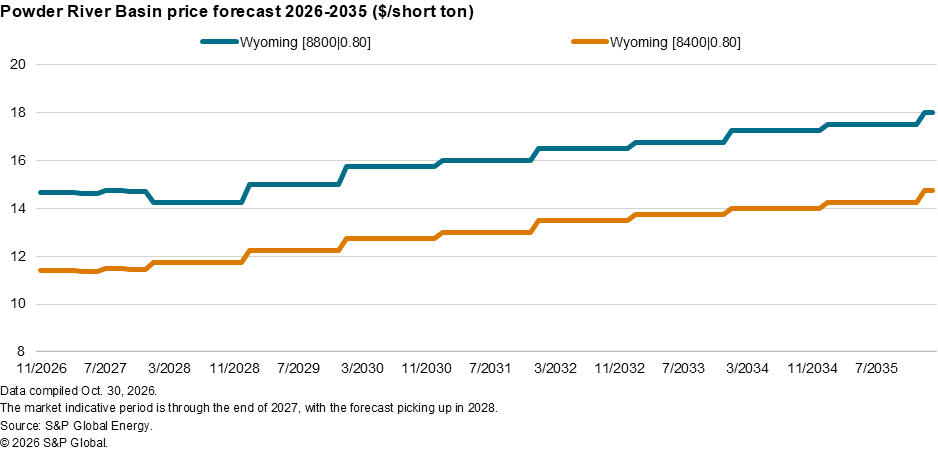
Current forward pricing for Powder River Basin coal has been flat and stable, reflecting surplus inventories at power plants. After 2027, declining coal demand is forecast to be offset by rising unit costs, driving modest price growth.
Bituminous coal prices are primarily influenced by export markets, with today's prices making domestic coal generation uncompetitive relative to Northeast natural gas. The current disruption in international energy markets has elevated export coal prices, likely through 2027. As natural gas prices normalize after 2027, we project flat-to-easing coal prices.
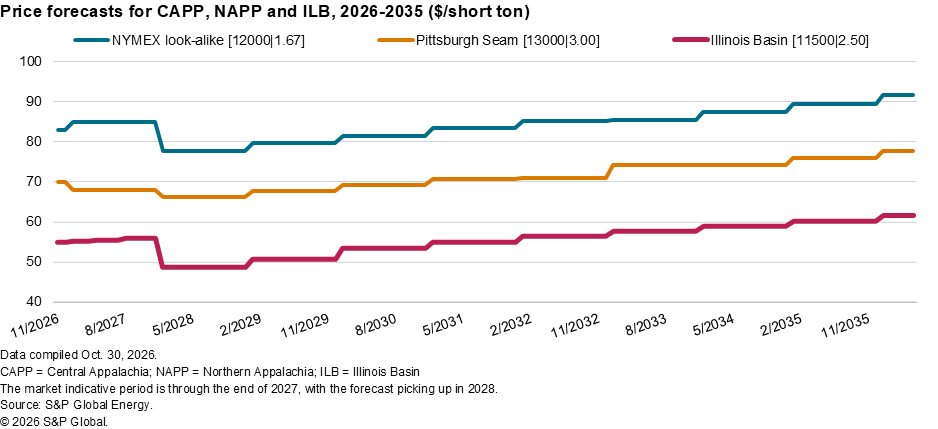
Pricing benchmarks exceeding $70/st suggest sustainable returns for eastern bituminous coal, with Atlantic Basin export coal above that threshold and coal competing in Pacific Basin export markets generally much closer to that threshold. Bituminous coal demand for electricity generation is expected to remain stable through 2027, driven by higher electricity demand. Declines in steam coal demand are expected to resume after 2027, and overall Eastern US coal demand is forecast to decline 55 million st in 2025-30.
Outlook for US coal production, demand
For the four weeks ending Oct. 24, coal shipments averaged 10.1 million st, 0.7% above the same period in 2025, as lingering summer heat supported ongoing coal demand.
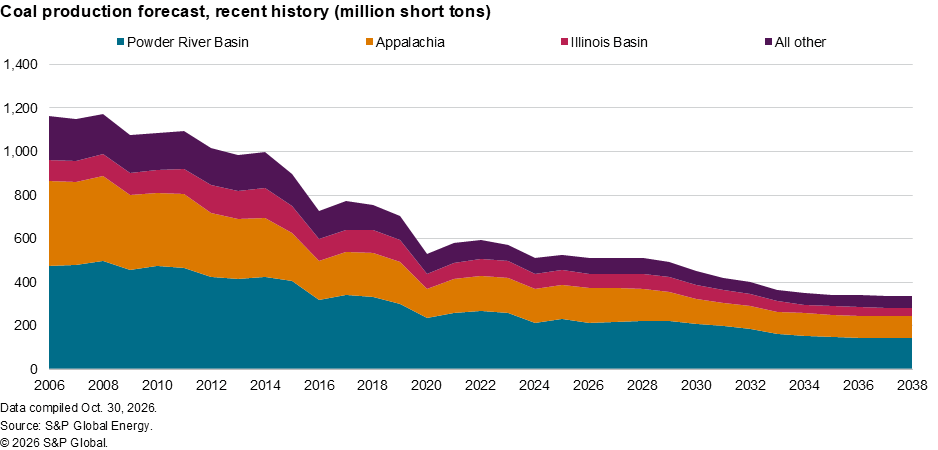
The chart below compares the current production forecast with recent history. We forecast production at 510 million st this year, a 3.2% decline from 2025, as milder overall weather conditions and lower natural gas prices suppress coal demand. We forecast flat production in 2027, with higher natural gas prices offset by robust coal inventories. Production holds near 510-511 million st through 2028 before falling to 493 million st in 2029, as growth in generation from natural gas and green energy is forecast to reduce coal generation. For comparison, the EIA's October outlook is higher, at 521.4 million st in 2026, down 1.3% from 528.4 million st in 2025. The overall coal market, including domestic demand and exports, is forecast to decline by 102 million st between 2026 and 2031.
Production outlook — Powder River Basin
Forecasts of reduced aggregate production this year are mainly attributable to declines in Powder River Basin production. Production reports from the Mine Safety and Health Administration (MSHA) covering the first half of 2026 indicate production of 101.4 million st, an annualized rate of 202.9 million st. Production for 2026 is now forecast at 212 million st, 7.8% below 2025. Production is forecast to grow to 216 million st in 2027 and 221 million st in 2028-29 against higher natural gas prices. By 2030, S&P Global Energy projects that coal retirements in the Midwest and the expansion of wind generation in PRB's core markets will gradually reduce coal demand to 207 million st, declining further to 147 million st by 2035.
Production outlook — Illinois Basin
MSHA's 2026 second-quarter production reports indicate first-half 2026 production of 35.0 million st, an annualized rate of 70.0 million st. We forecast production will hold at 67 million st this year and next, edging up to 69-70 million st in 2028-29, after which the expansion of wind generation and announced coal retirements are forecast to erode ILB coal demand. Coal production in the ILB is forecast to fall to 66 million st by 2030, declining further to 41 million st by 2035.
Production outlook — Appalachian basins
MSHA's production reports for the second quarter of 2026 indicate first-half 2026 production of 81.9 million st, an annualized rate of 163.9 million st. Appalachian coal demand tends to be more sensitive to global seaborne markets than to domestic natural gas prices, compared with the PRB or the ILB, which are forecast to see improved demand relative to natural gas generation; therefore, gains in Appalachian coal will be more limited. We forecast production of 160 million short tons this year, easing to 156 million st in 2027. As remaining domestic demand erodes, with only modest offsets from export growth, Appalachian production is forecast to fall to 116 million st by 2030 and 101 million st by 2035.
Further information
Market Indicative coal forecasts by S&P Global Energy represent forward curves for spot-traded instruments, analogous to a strip of contracts. The shorter tenors — current year and prompt year, plus additional years, if available — are driven by the observed/assessed marker prices. The longer tenors — typically forecast years three to 20 for physically assessed markers — are driven by fundamental estimates of cash costs of production, accepted returns to capital, regional productive capacity, and forecast supply and demand. For the long-tenured portion of the curve, S&P Global Energy forecasts prices for specific coal markers and defines the remaining markers via historical spreads.
S&P Global Energy produces content for distribution on S&P Capital IQ Pro.
For further details on coal prices, supply and demand, visit the S&P Coal Forecast Summary page.
This article was published by S&P Global Market Intelligence and not by S&P Global Ratings, which is a separately managed division of S&P Global.