Research — October 27, 2026
BP earnings preview: Q3 2026
BP PLC (NYSE: BP) is scheduled to report its third-quarter results on Friday, Oct. 30, with Visible Alpha consensus pointing to another strong quarter.
Earlier this month, the oil and gas exploration company updated its expectations for the third quarter of 2026, pointing to stronger underlying earnings, led by improved refining margins and gas trading, stable upstream production, and sharply lower net debt, partly offset by weaker customer and oil-production results and significant transition-related impairments.
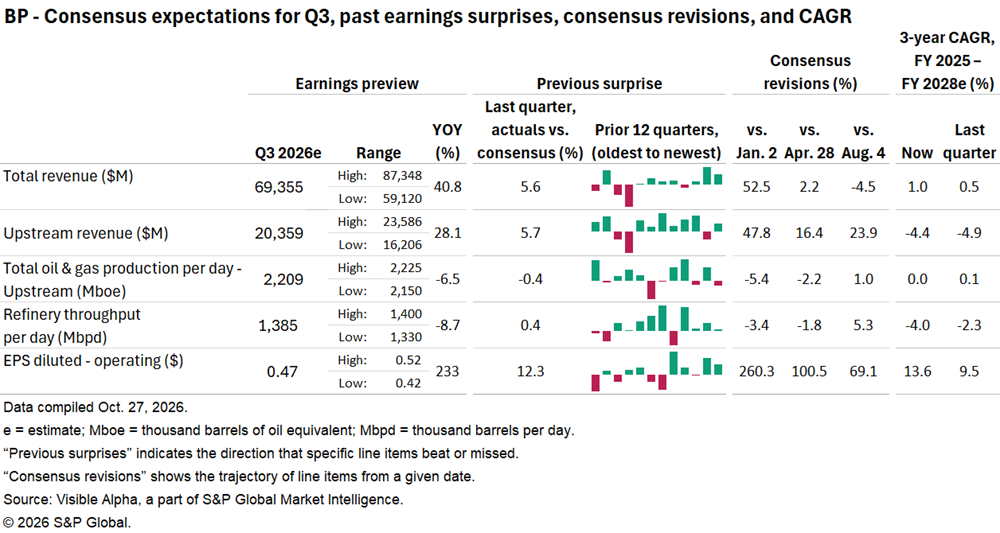
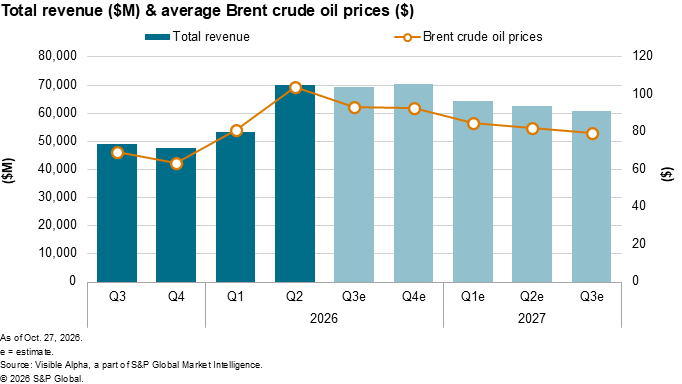
Visible Alpha consensus expects third-quarter total revenue of $69.36 billion, up 40.8% from the year-ago quarter. The range of forecasts is wide, indicating some uncertainty around price and volume dynamics. Upstream revenue is projected to climb 28.1% to $20.40 billion.
Brent crude is estimated to average $93 per barrel in the third quarter, softening sequentially from $104 per barrel last quarter, but far above the $69 per barrel level a year ago.
Analysts expect diluted operating earnings per share to reach 47 cents, a year-over-year increase of 233%. The consensus EPS estimate for the quarter has been revised 40.8% higher over the last 30 days to the current level.
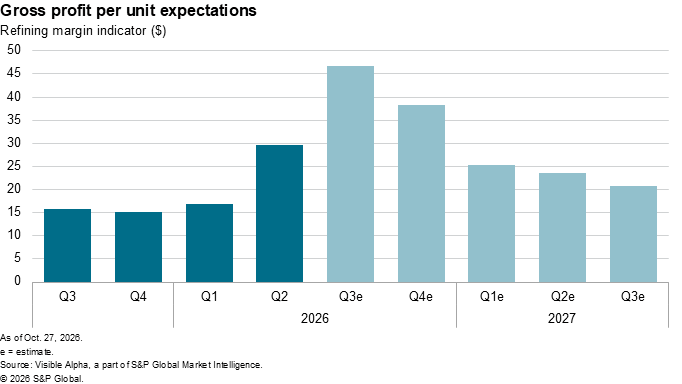
Analysts expect the refining indicator margin to jump to $46.73 per barrel, up from $29.60 in the second quarter.
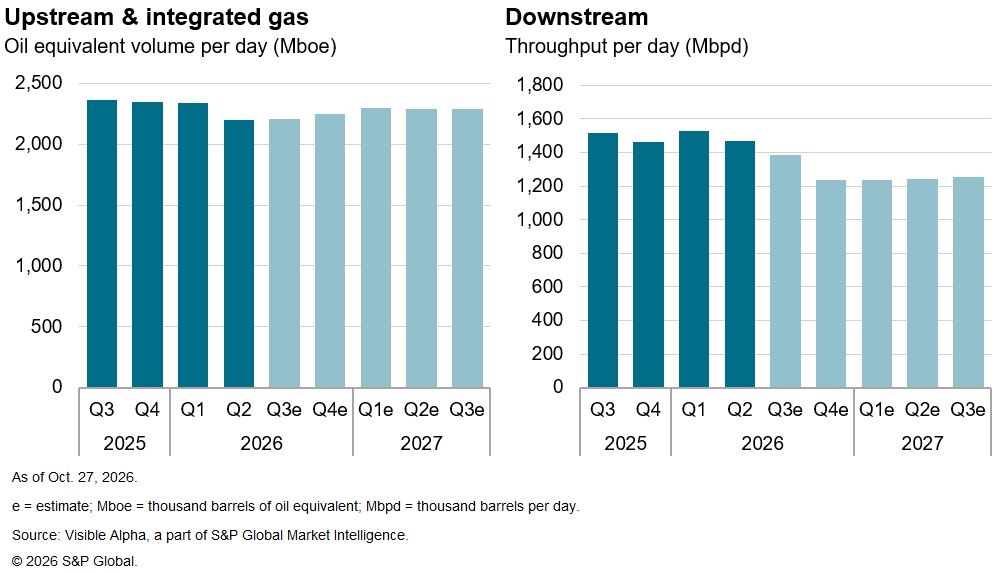
Despite the price tailwind, BP's upstream production is expected to average 2.21 million barrels of oil equivalent per day in Q3, down 6.5% year over year and largely unchanged from the second quarter. Refinery throughput is forecast to show a steeper decline, falling 8.7% year over year to 1.39 million barrels per day in Q3, and down 6% sequentially.
Important notice
Any views not otherwise cited are based on Visible Alpha data and a compilation of the corresponding broker research reports.
Usage of this product is governed by the S&P Global Market Intelligence Agreement, as applicable.
Privacy Policy and Cookie Notice Terms of Use Legal Disclaimer Third Party Disclaimer
Site content and design Copyright © 2026, S&P Global Market Intelligence
This article was published by Visible Alpha, part of S&P Global Market Intelligence and not by S&P Global Ratings, which is a separately managed division of S&P Global.
Content Type
Products & Offerings
Segment


