Research — Aug 01, 2026
TV satisfaction rebounds in 2026 as sports, streaming bundles boost engagement

By Brian Bacon
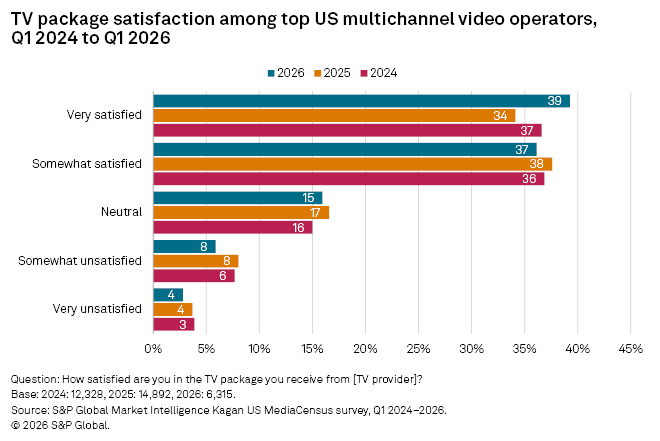
Results from S&P Global Market Intelligence Kagan's MediaCensus online consumer survey, conducted in the first quarter of 2026, show that TV package satisfaction rates have bounced back after taking a hit in 2025, with the share of subscribers who were very satisfied increasing from 34% in 2025 to 39% in 2026. Satisfaction rates are impacted by a variety of factors, including how much live TV is watched, whether subscribers frequently view major pro sports and if they use SVOD services that are now included in some pay TV packages.
Access full tables in Excel format, including additional data, here.

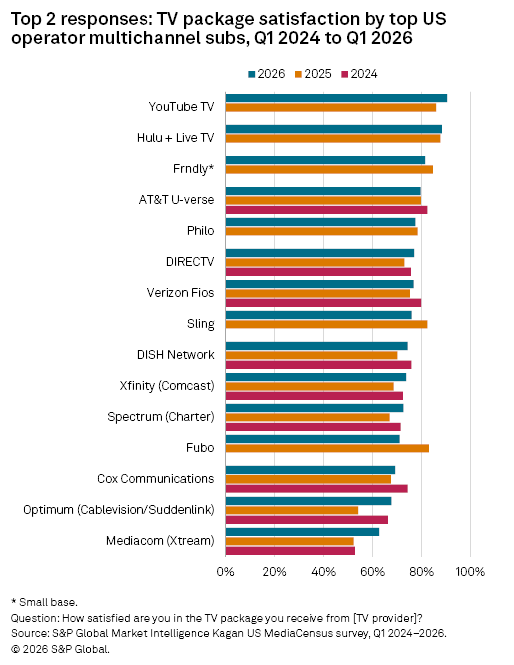
➤ Virtual multichannel operators still hold the largest share of satisfied subscribers, led by YouTube TV and Hulu + Live TV.
➤ Satisfaction was higher among Spectrum subs who indicated they also used SVOD services included in select TV packages.
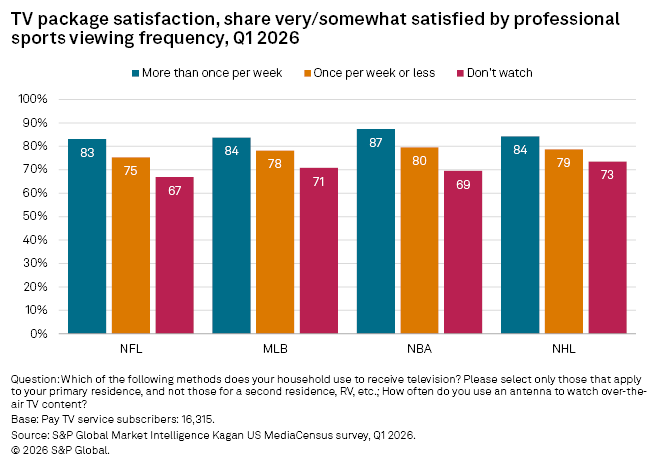
➤ Sports viewers were more likely than other live TV viewers to indicate they were either very or somewhat satisfied with their TV service, especially those who viewed sports frequently.

Examining satisfaction rates by operator shows that Alphabet Inc.'s YouTube TV and Walt Disney Co.'s Hulu + Live TV had the largest shares of satisfied subscribers, with very/somewhat satisfied at 90% and 88%, respectively. Among the traditional operators surveyed, AT&T Inc.'s U-verse retained the largest share of satisfied subs at 80%, the same as the prior year's data. The operator with the largest increase in share compared to 2025 results was Optimum Communications Inc., which fell from 66% in 2024 to 54% in 2025, only to bounce back up to 68% in 2026.
Subscribers to select Charter Communications Inc. Spectrum TV packages receive access to up to 10 online streaming services. Examining TV package satisfaction among Spectrum TV subs shows that satisfaction was higher among those who use these services compared to those who only use other SVOD services or do not use any SVOD services. Among users of the specific services, those using FOX One and ViX Premium were the most likely to be very/somewhat satisfied with their Spectrum TV package at 89% and 88%, respectively.
Sports viewership also ties into satisfaction rates. Over 80% of those watching more than once per week reported being very/somewhat satisfied across the four major professional sports leagues. Respondents watching games once per week or less were less likely to be satisfied with their TV service, while those not watching were the least likely to be satisfied.
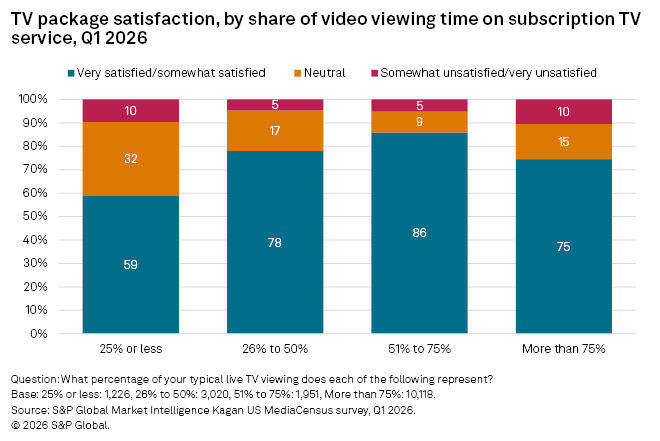
Satisfaction is also tied to how much of respondents’ live TV viewing time was on their TV service versus over-the-air (OTA) or free ad-supported TV (FAST) services. Among those who indicated that their TV service accounted for 25% or less of their video viewing time, 59% indicated they were very/somewhat satisfied with their TV service. By comparison, those viewing more than 25% of their video content through their TV service were much more likely to be satisfied with their TV service.
Satisfaction was very similar among those who have supplemented their TV subscriptions with OTA channels and those who do not. However, those who use OTA at least once per week were more likely to indicate that they were very satisfied with their TV package at 41%, compared to infrequent OTA viewers at 32%.
Data presented in this article is from the MediaCensus survey conducted in the first quarters of 2024 to 2026. This sample included 17,743 (2024), 18,985 (2025) and 16,315 (2026) US internet adults matched by age and gender to the US Census. The survey results have a margin of error of +/-0.98 ppts at the 95% confidence level. Survey data should only be used to identify general market characteristics and directional trends.
For more information about the terms of access to the raw data underlying this survey, please contact support.mi@spglobal.com.
Consumer Insights is a regular feature from S&P Market Intelligence Kagan.
This article was published by S&P Global Market Intelligence and not by S&P Global Ratings, which is a separately managed division of S&P Global.
Content Type
Theme
Segment
Language