Blog — 27 May, 2026
US Power Outlook: How Surging Demand Is Reshaping the Generation Puzzle
By Steve Piper and Adam Wilson
The North American power sector is navigating a transformation driven by unprecedented electricity demand from data centers, industrial growth, and economy-wide electrification. The old paradigm of choosing between low-cost or dispatchable power has been replaced by a complex matrix where grid operators must balance cost, reliability, and emissions across a diverse and evolving technology landscape.
Insights from the S&P Global webinar, “Amid surging demand, complexity of the power supply puzzle grows,” reveal how these dynamics are reshaping regional markets, technology costs, and long-term capacity planning. The analysis shows convergent economics are creating intense competition between generation types, while significant revisions to load forecasts, particularly in PJM, create a two-speed outlook for the decade ahead.
Key Highlights
- Convergent Economics: The levelized cost of capacity (LCOC) for gas turbines, solar, and battery storage are converging, creating intense competition. While gas generator costs are rising, battery storage costs continue to decline, with stand-alone batteries projected to be the cheapest firm resource by 2030.
- PJM’s Shifting Demand: PJM’s near-term load forecast has been revised downward due to a new vetting process for datacenter demand. However, the long-term forecast shows even higher growth, with a compound annual growth rate of 3.7% projected for the next 10 years.
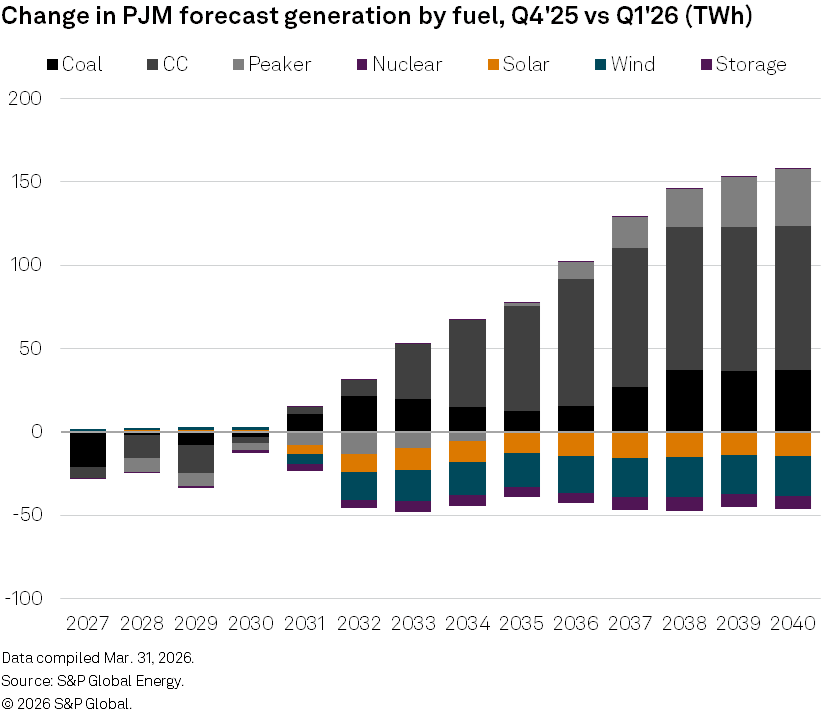
- A Two-Speed Generation Mix: In the near term, PJM’s lower demand and expanding renewables will reduce reliance on fossil fuels. Post-2030, however, surging demand is forecast to increase utilization for baseload coal and combined-cycle gas to ensure grid reliability.
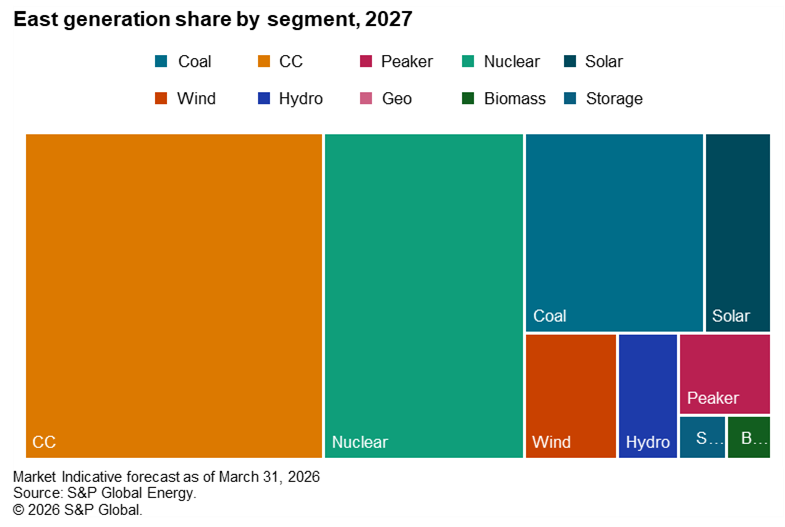
- Regional Diversity: Different regions are pursuing distinct pathways. The Midcontinent sees gas generation holding strong against renewables, the West is being reshaped by solar and storage, and the East relies on a mix of gas and nuclear, with solar showing strong economic performance.
- Corporate Procurement Trends: Corporate clean energy procurement remains robust, driven almost entirely by datacenter and technology companies. Solar dominates with over 50% of capacity signed, but carbon-free alternatives like nuclear and hydro are gaining momentum.
Five Key Takeaways from the Q1 2026 US Power Forecast webinar
1. Technology Costs Are Converging, Intensifying Competition
The economic calculus for new power generation is shifting. Capital costs for simple- and combined-cycle gas generators are forecast to continue rising through 2030, driven by supply chain constraints and inflation. In contrast, costs for battery storage are trending downward due to technological improvements and expanding onshore manufacturing. This dynamic is leading to what S&P Global analysts call "convergent economics," in which the levelized cost of capacity (LCOC) across technologies is becoming increasingly aligned. By 2030, stand-alone batteries are projected to have the lowest LCOC, making them 30%-40% cheaper than gas and hybrid options and the most cost-effective firm resource.

2. PJM’s Revised Load Forecast Creates a Near-Term Reprieve but a Long-Term Challenge
A significant update to PJM’s long-term load forecast has altered the outlook for the nation’s largest grid operator. A new vetting process for planned datacenters has lowered the near-term demand forecast between 2026 and 2030. While this provides temporary relief, the demand curve shifts sharply upward in the following years. The latest forecast projects a compound annual growth rate of 3.7% over the next decade—a significant increase from previous outlooks. This revision creates a complex planning environment, pushing the most acute demand pressures into the early 2030s.

3. PJM’s Generation Mix Is Set for a Two-Part Transformation
The revised demand forecast directly impacts PJM’s generation mix. In the near term (through 2030), reduced demand growth combined with the expansion of pipeline renewables will lower generation from coal and combined-cycle gas plants. However, this trend reverses dramatically after 2030. As long-term demand surges, utilization rates for both coal and combined-cycle natural gas are expected to rise to meet higher baseload needs. Peaking gas plants, initially displaced by renewables, become increasingly critical after 2032 to support high baseload capacity factors as the pace of renewable additions tapers.
4. Regional Markets Showcase Diverse Decarbonization and Reliability Strategies
There is no single solution to the power supply puzzle, as different regions leverage their unique resources and market dynamics. In the Midcontinent, gas combined-cycle generation is effectively weathering the expansion of renewables by taking market share from retiring coal plants. In the Western Interconnect, solar and storage are reshaping the grid, though saturation is leading to curtailment and a focus on hybrid projects, while offshore wind is a key part of the long-term green generation strategy. In the East, strong demand growth ensures gas combined-cycle remains in the mix, while low solar penetration gives it significant room to expand and outperform gas economically in the near term.


5. Datacenters Drive Corporate Clean Energy Deals, with Solar Leading the Way
Corporate procurement of clean energy shows no signs of slowing, with over 161 GW of carbon-free capacity now contracted by non-utility offtakers. This activity is overwhelmingly driven by technology and datacenter companies seeking to meet sustainability commitments. Solar dominates these deals, accounting for over 50% of the cumulative capacity share. While wind’s share has declined, other carbon-free technologies like nuclear, hydroelectric, and geothermal are gaining traction as corporate focus shifts from "renewable" to the broader "carbon-free" category. Geographically, Texas is home to nearly 40% of this contracted capacity, and the top five states (TX, OH, IL, PA, VA) are all major datacenter hubs.

How S&P Capital IQ Pro Supports Power Market Analysis
Navigating the complexities of the US power market requires granular data and forward-looking analysis. S&P Capital IQ Pro provides the critical insights needed to understand the interplay between technology costs, policy shifts, and market fundamentals. Access detailed 20-year forward-looking wholesale power prices, capacity-price projections and operational forecasts to conduct power plant valuations and forecast estimated revenue. Connect asset-level economic analysis and expert commentary on regional power market dynamics to identify risks and opportunities in a sector undergoing rapid transformation.
What the data shows about the US power market transformation
How are technology costs affecting the US power generation mix?
Rising capital costs for gas generators and declining costs for battery storage are creating "convergent economics." This intensifies competition, with stand-alone batteries forecast to become the cheapest firm resource by 2030.
What is the latest PJM load forecast for 2026 and beyond?
PJM's near-term load forecast has been revised lower, but the long-term forecast is significantly higher, projecting a 3.7% compound annual growth rate over the next 10 years due to datacenter and industrial demand.
How will PJM's generation mix change in the long term?
After 2030, PJM is expected to see increased utilization of baseload coal and combined-cycle gas to meet surging demand. Peaking gas plants will also become more critical to ensure reliability as renewable growth slows.
What are the key power generation trends in different US regions?
The Midcontinent relies on gas to balance renewables, the West is being reshaped by solar and storage, and the East uses a mix of gas and nuclear. These diverse strategies reflect unique regional resources and market conditions.
What is driving corporate clean energy procurement in the US?
Corporate procurement is driven almost entirely by datacenter and technology companies aiming to meet sustainability targets. These companies account for the vast majority of clean energy power purchase agreements (PPAs).
Which technology dominates corporate clean energy deals?
Solar is the dominant technology, representing over 50% of all cumulative corporate clean energy capacity signed. However, other carbon-free sources like nuclear and hydroelectric are gaining momentum.
Theme
Location
Products & Offerings
Segment
