


Guide to Integrated Telecom KPIs
This guide highlights the key performance indicators for the integrated telecommunications industry and where investors should look to find an investment edge.
Industry Overview
The integrated telecommunications industry consists of companies that provide telecommunication services using airwaves (wireless) and/or cables (wireline). These companies provide a variety of services, including voice calling, data and video.

Key Telecom Metrics
Key performance indicators (KPIs) are the most important business metrics for a particular industry. When understanding market expectations for integrated telecommunications, whether at a company or industry level, here are some of the telecom KPIs to consider:
- Ending Subscribers
- Net Additions
- Average Revenue Per User (ARPU)
- Churn Rate
- Gross Additions
- Disconnects
- EBITDA Margin
- Capex to Sales
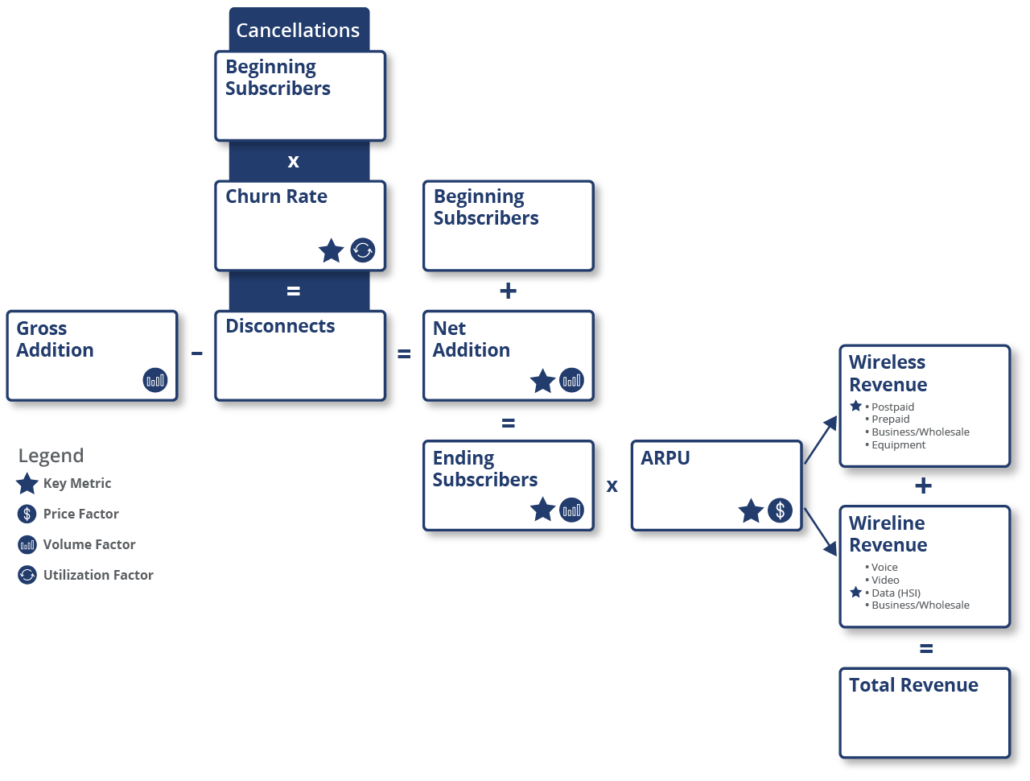
Telecom Business Model
-
Expenses
-
Revenue
-
Other Key Items & Ratios
There are two broad categories of expenses for telecom companies:
- Operating costs and other expenses: Network costs is one of the main operating costs for a telecom, representing spectrum charges, infrastructure rent and maintenance costs. Selling, general and administrative expenses are another key expense for a telecom company and include the cost of acquiring new customers. Due to the capital-intensive nature of the industry, depreciation and amortization is another large expense for telecoms.
- Capital expenditures (Capex): A capital-intensive industry, telecom companies require extensive network infrastructure to provide fixed line and wireless services, which are accounted for as a capital expenditure. Capital expenditures also cover the cost of purchasing spectrum, government licensing fees, hardware (fiber cables, BTS) and the software required for their infrastructure.
Telecom service providers (TSPs) generate revenue by providing products and services to retail and business customers using their wireless and wireline networks, through either single or bundled arrangements. The services provided can involve multiple deliverables that include products, services or a combination of both.
A TSP’s primary business model is driven by the volume of their subscribers and the price they charge for the services rendered (typically measured as average revenue per user or ARPU). Revenue is modeled as average subscribers in a period multiplied by the average monthly revenue per user for that period for each service segment. The typical service segments include prepaid and postpaid voice, data and video to retail and business customers.
As a customer-facing business, one of the key metrics tracked by investors for TSPs is ending subscribers. Increases and decreases in subscribers are also closely monitored and are identified as net additions. Every new subscriber (gross subscriber addition) adds new revenue for a TSP, and every subscriber disconnecting the service increases the churn rate for the company and represents a loss of revenue.
TSPs also earn a small portion of revenue by cross-selling wholesale mobile virtual network operator (MVNO) services to other telecom companies, and through the sale of telecommunication equipment by leasing contracted phone devices. For example, T-Mobile earns wholesale revenue by sharing their network with Verizon and DISH. Similarly, AT&T has commercial arrangements with telecom providers to share their network, which generates wholesale (reseller) revenue.
Companies in the industry will typically report revenue from wireless and wireline services to retail, business and wholesale customers, as well as from equipment revenue. For traditional wireless services, equipment revenue often refers to the equipment plans provided to customers to purchase smartphones and other internet devices using installments.
Investors evaluate profitability by looking at the level and directional change of EBITDA margin while free cash flow (FCF) helps track operational efficiency.
The capex-to-sales ratio helps investors measure how much revenue is ploughed back into capital expenses as these companies continuously maintain, replace and upgrade productive assets.
Finally, investors monitor EBITDA/interest expense and net debt/EBITDA for investment efficiency and leverage.
Available Comp Tables - Consensus Estimates
Visible Alpha offers 68 integrated telecommunications comp tables, comparing forecasts for key financial and operating metrics, to make it easy to quickly conduct relative analysis, whether you are interested in looking at key values for Verizon competitors or churn rate for Swedish wireless services. Every pre-built, customizable comp table is based on region and/or key operating metrics.
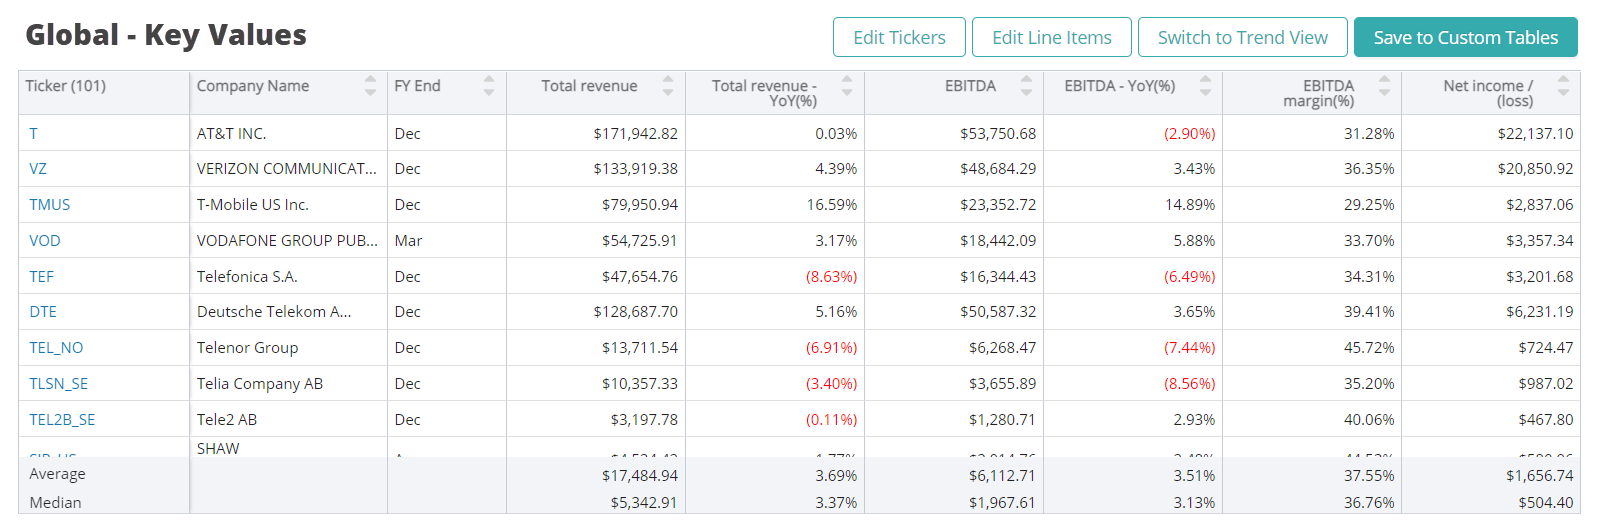
Global Financial and Operating KPIs Company Examples:
North America
- AT&T INC. (T)
- BCE Inc. (BCE_CN)
- Rogers Communications (RCI)
- T-Mobile US Inc. (TMUS)
- VERIZON COMMUNICATIONS INC. (VZ)
EMEA
- Deutsche Telekom AG (DTE)
- Swisscom AG (SCMN_CH)
- Telefonica S.A. (TEF)
- Telecom Italia SpA (TIT_IM)
- VODAFONE GROUP PUBLIC LTD CO (VOD)
LATAM
- AMERICA MOVIL SAB DE CV (AMX)
- Empresa Nacional de Telecomunicaciones SA (ENTEL_CL)
- Oi S.A. (OIBR4_BR)
- TIM PARTICIPACOES (TSU_US)
- TELEFONICA BRASIL S.A. (VIVT4_SA)
APAC
- Axiata Group (AXIA_MY)
- Bharti Airtel Ltd (BHARTI_IN)
- China Mobile Limited (0941_HK)
- KDDI Corporation (9433_JP)
- Singapore Telecommunications Ltd (ST_SP)
Download Report
This guide highlights the key performance indicators for the integrated telecommunications industry and where investors should look to find an investment edge, including:
- Telecom Industry Business Model & Diagram
- Key Telecom Metrics PLUS Visible Alpha’s Standardized Industry Metrics
- Available Comp Tables
- Industry KPI Terms & Definitions