


Guide to Social Media Industry KPIs
This guide highlights the key performance indicators for the social media industry and where investors should look to find an investment edge.
Industry Overview
The social media industry comprises companies that create web platforms and applications where users can connect, share ideas and content, and communicate via text, videos, and images. Social media platforms have also become popular advertising platforms for businesses and advertisers. Furthermore, these platforms are increasingly being used for social commerce, allowing businesses to engage with consumers and set up online shops to sell products. Some of the more popular social media platforms include Meta’s Facebook, Instagram, and WhatsApp; Alphabet’s YouTube; and Twitter.
Advertising constitutes a substantial proportion of the revenue earned by social media companies. While digital advertising is not limited to social media platforms, this guide specifically concentrates on social media companies. For example, Alphabet generates advertising revenue not just from its social media platform YouTube, but also from search and display advertising on Google Search. Similarly, Amazon generates advertising revenue from sponsored display ads and OTT video ads on its streaming platform, but it does not operate any social media platform, which is why it falls outside the scope of this guide.
The social media industry is constantly evolving, with new platforms and features emerging all the time. It has grown rapidly over the past decade, driven by increasing internet access, the growth of smart devices, and the rise of social commerce. As a result, social media companies have become key players in the digital economy, generating substantial advertising and e-commerce revenue. The industry is constantly evolving, as new technologies and platforms emerge and usage expands into areas such as e-commerce, content creation, and business marketing.

Key Social Media Industry Metrics
Key performance indicators (KPIs) are the most important business metrics for a particular industry. When understanding market expectations for the social media industry, whether at a company or industry level, some KPIs to consider include:
- Total Digital Advertising Revenue
- Monthly Active Users (MAUs)
- Daily Active Users (DAUs)
- Average Revenue Per MAU
- Average Revenue Per DAU
- DAU-to-MAU Ratio
- Ad Impressions Growth
- Total Impressions
- Effective Cost Per Thousand Impressions (eCPM)

Social Media Industry Business Model
-
Expenses
-
Revenue
-
Profitability
Social media companies typically incur several major expenses, including:
- Selling and marketing: to increase brand awareness and acquire new users.
- Research and development (R&D): to continuously improve and innovate their products and services.
- Server and data center operations: to store and manage the vast amounts of data generated by users.
- Employee salaries and benefits: to retain and attract top talent.
- Legal and compliance: to comply with regulations and protect intellectual property.
- Content acquisition: to secure content licenses and partnerships with content creators and publishers.
- Infrastructure and equipment: to maintain and upgrade technology and hardware.
These expenses vary by company, and may also depend on the company’s size, revenue, and target market.
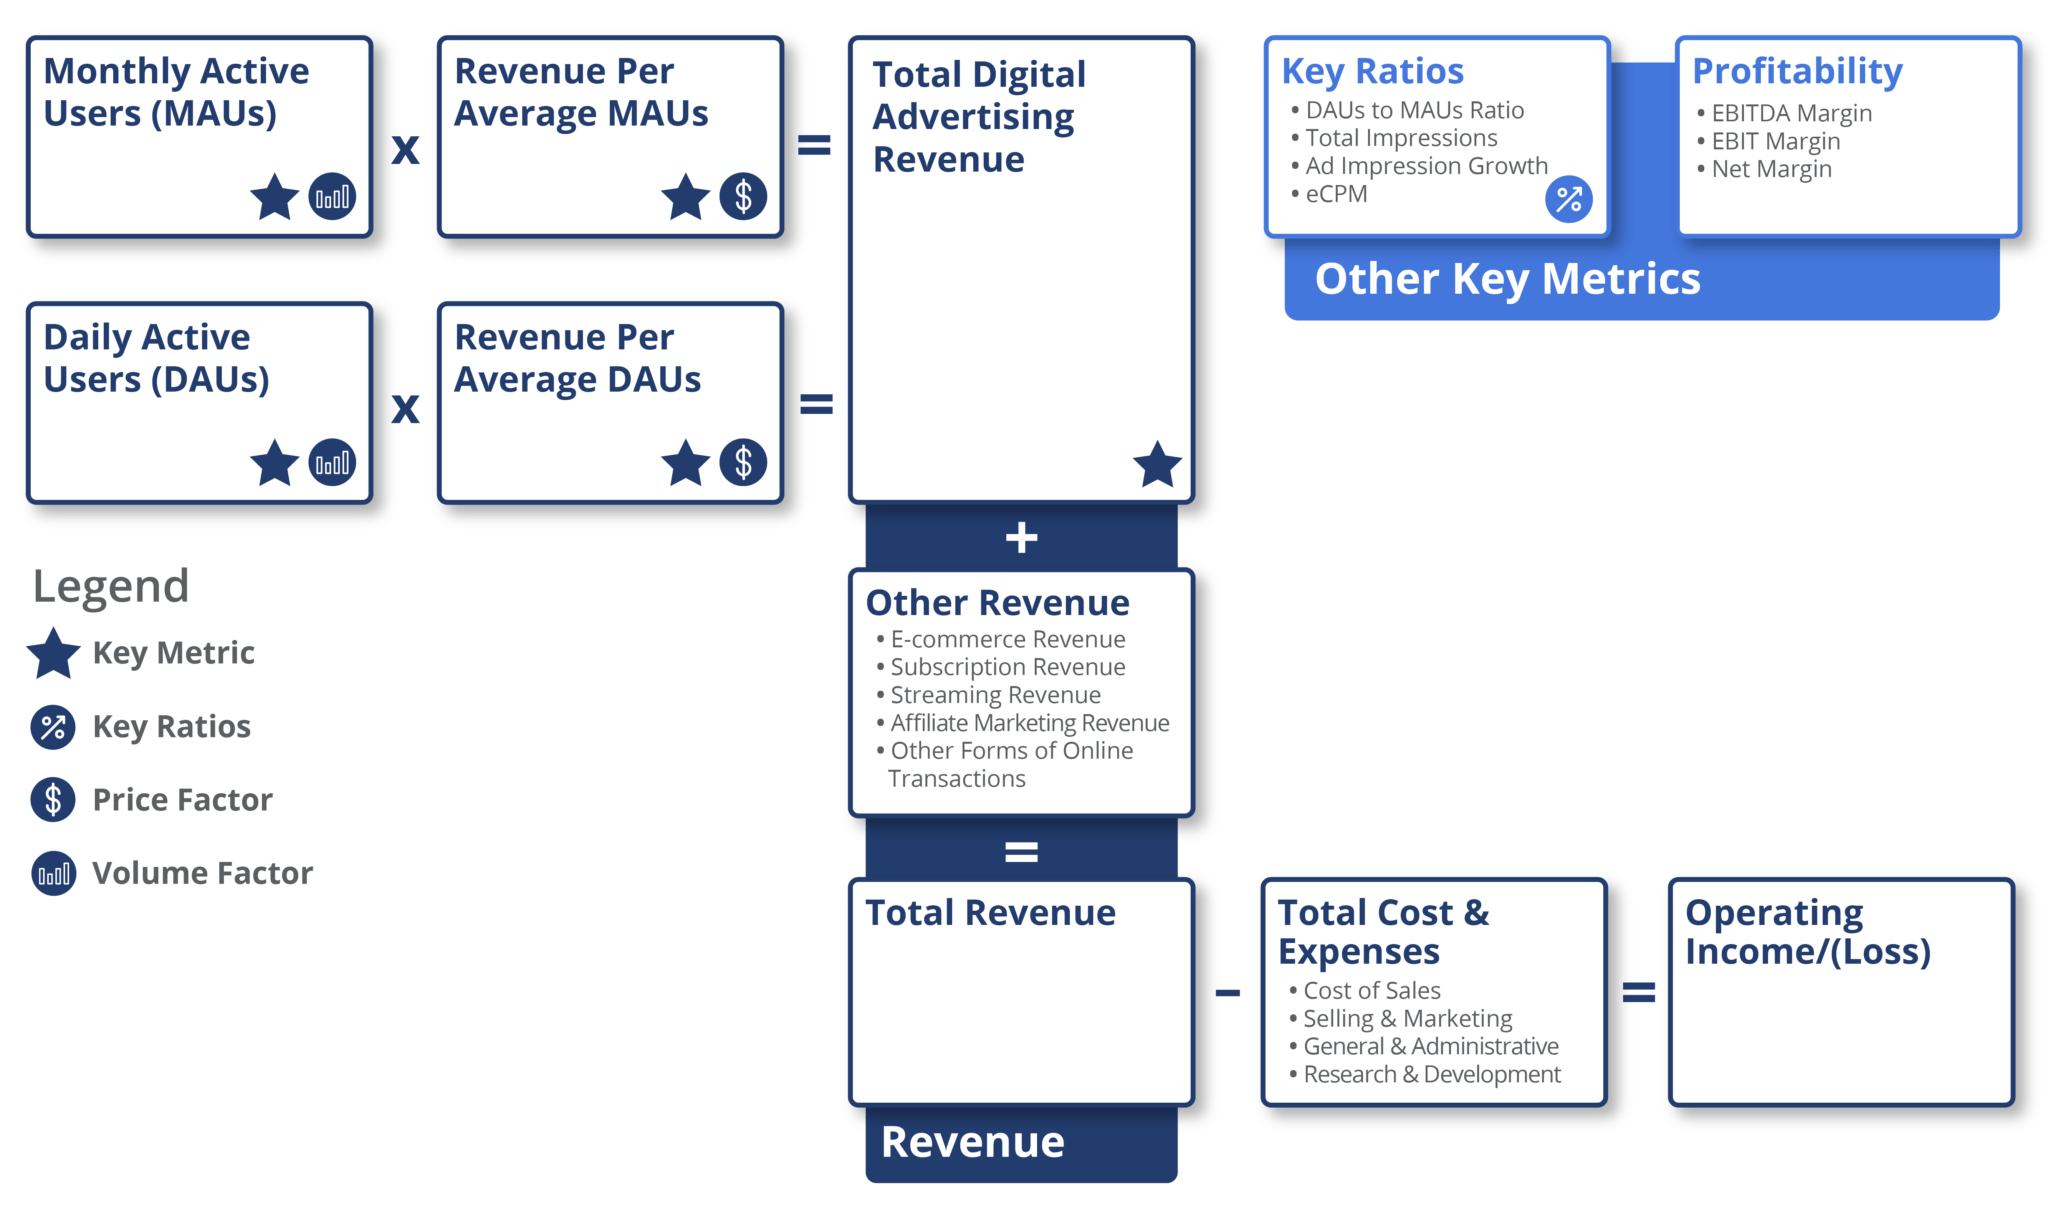
The business model for social media companies typically revolves around advertising and the sale of additional features or services to users. Social media companies monetize user engagement through advertising, data collection and analysis, and partnerships with businesses and organizations. They generate revenue by displaying ads to users and charging businesses for access to user data, as well as for promoted posts, sponsored content, and other forms of advertising. Additionally, many social media platforms also offer premium features and services to users for a fee. Some also generate revenue through e-commerce, affiliate marketing, and other forms of online transactions.
We can divide the revenue generated by social media companies into advertising revenue and revenue generated from other services such as listing services, transaction services, and others. Analysts often look at active user metrics like MAUs (monthly active users) and DAUs (daily active users) to get a sense of the unique accounts that logged in or accessed a social media platform in a given time frame. DAUs are the number of unique users who visit a social media platform once within a 24-hour period. MAUs refer to the number of unique users who logged into a social media account at least once in the preceding 30-day period as of the measurement date. The average is determined by dividing the total number of active users in a specified period by the number of days/months in that period. Average MAUs/DAUs are then multiplied by ARPU (average revenue per user) to calculate the digital advertising revenue. ARPU represents the average revenue generated from each user in a given period. Finally, digital advertising revenue is added to other revenue sources to yield the total revenue generated by social media companies.
Another important metric for social media companies is the DAU-to-MAU ratio, which helps determine the social media platform’s stickiness, or the frequency with which users engage with it. In addition, impressions and eCPM (effective cost per thousand impressions) are analyzed. Impression analysis gives an estimate of revenue based on user activity, while eCPM represents the cost an advertiser pays for every 1,000 views or clicks of an ad.
Operating margin, EBITDA margin, and net margin are all financial metrics that analysts use to measure the profitability of social media companies.
- EBITDA margin measures a company’s EBITDA (Earnings Before Interest, Taxes, Depreciation, and Amortization) as a percentage of its revenue. It is a measure of the company’s operating performance and its ability to generate cash flows. A higher EBITDA margin indicates a stronger operating performance.
- Operating margin measures a company’s operating income as a percentage of its revenue. It shows how much profit a company generates from its operations, after deducting its operating expenses. A higher operating margin indicates better efficiency in managing costs.
- Net margin measures a company’s net income as a percentage of its revenue. It represents the company’s bottom line profitability after all expenses, including taxes and interest, have been deducted from its revenue. A higher net margin indicates better profitability and effective management of the company’s costs and expenses.
Available Comp Tables - Consensus Estimates
Visible Alpha offers five social media-related comp tables, comparing forecasts for key financial and operating metrics, to make it easy to quickly conduct relative analysis, whether you are interested in looking at key values for global companies, Americas, or Europe. Every pre-built, customizable comp table is based on region, sub-industry, or key operating metrics.

Global Financial and Operating KPIs Company Examples:
North America
- Meta Platforms Inc (NASDAQ: META)
- Alphabet Inc. (NASDAQ: GOOGL)
- Snap Inc (NYSE: SNAP)
- Pinterest Inc (NYSE: PINS)
- Match Group (NASDAQ: MTCH)
APAC
- Tencent Holdings (HKG: 0700, OTCMKTS: TCEHY)
- Baidu, Inc. (HKG: 9888, NASDAQ: BIDU)
- Kuaishou Technology (HKG: 1024, OTCMKTS: KUASF)
- Weibo Corp (HKG: 9898, NASDAQ: WB)
- Naver Corp (KRX: 035420)
Download Report
This guide highlights the key performance indicators for the social media industry and where investors should look to find an investment edge, including:
- Social Media Industry Business Model & Diagram
- Key Social Media Industry Metrics PLUS Visible Alpha’s Standardized Industry Metrics
- Available Comp Tables
- Industry KPI Terms & Definitions