


Guide to Retail REITs Industry KPIs
This guide highlights the key performance indicators for the Retail REITs industry and where investors should look to find an investment edge.
Industry Overview
Retail REITs, which stands for retail real estate investment trusts are companies that invest in retail properties and rent the space in those properties to retail tenants looking to set up shopping malls, restaurants, entertainment centers, boutiques, grocery-anchored shopping centers that feature big-box retailers, among others.
Key Asset Management Industry Metrics
Key performance indicators (KPIs) are the most important business metrics for a particular industry. When understanding market expectations for Retail REITs, whether at a company or industry level, some Retail REITs KPIs to consider are:
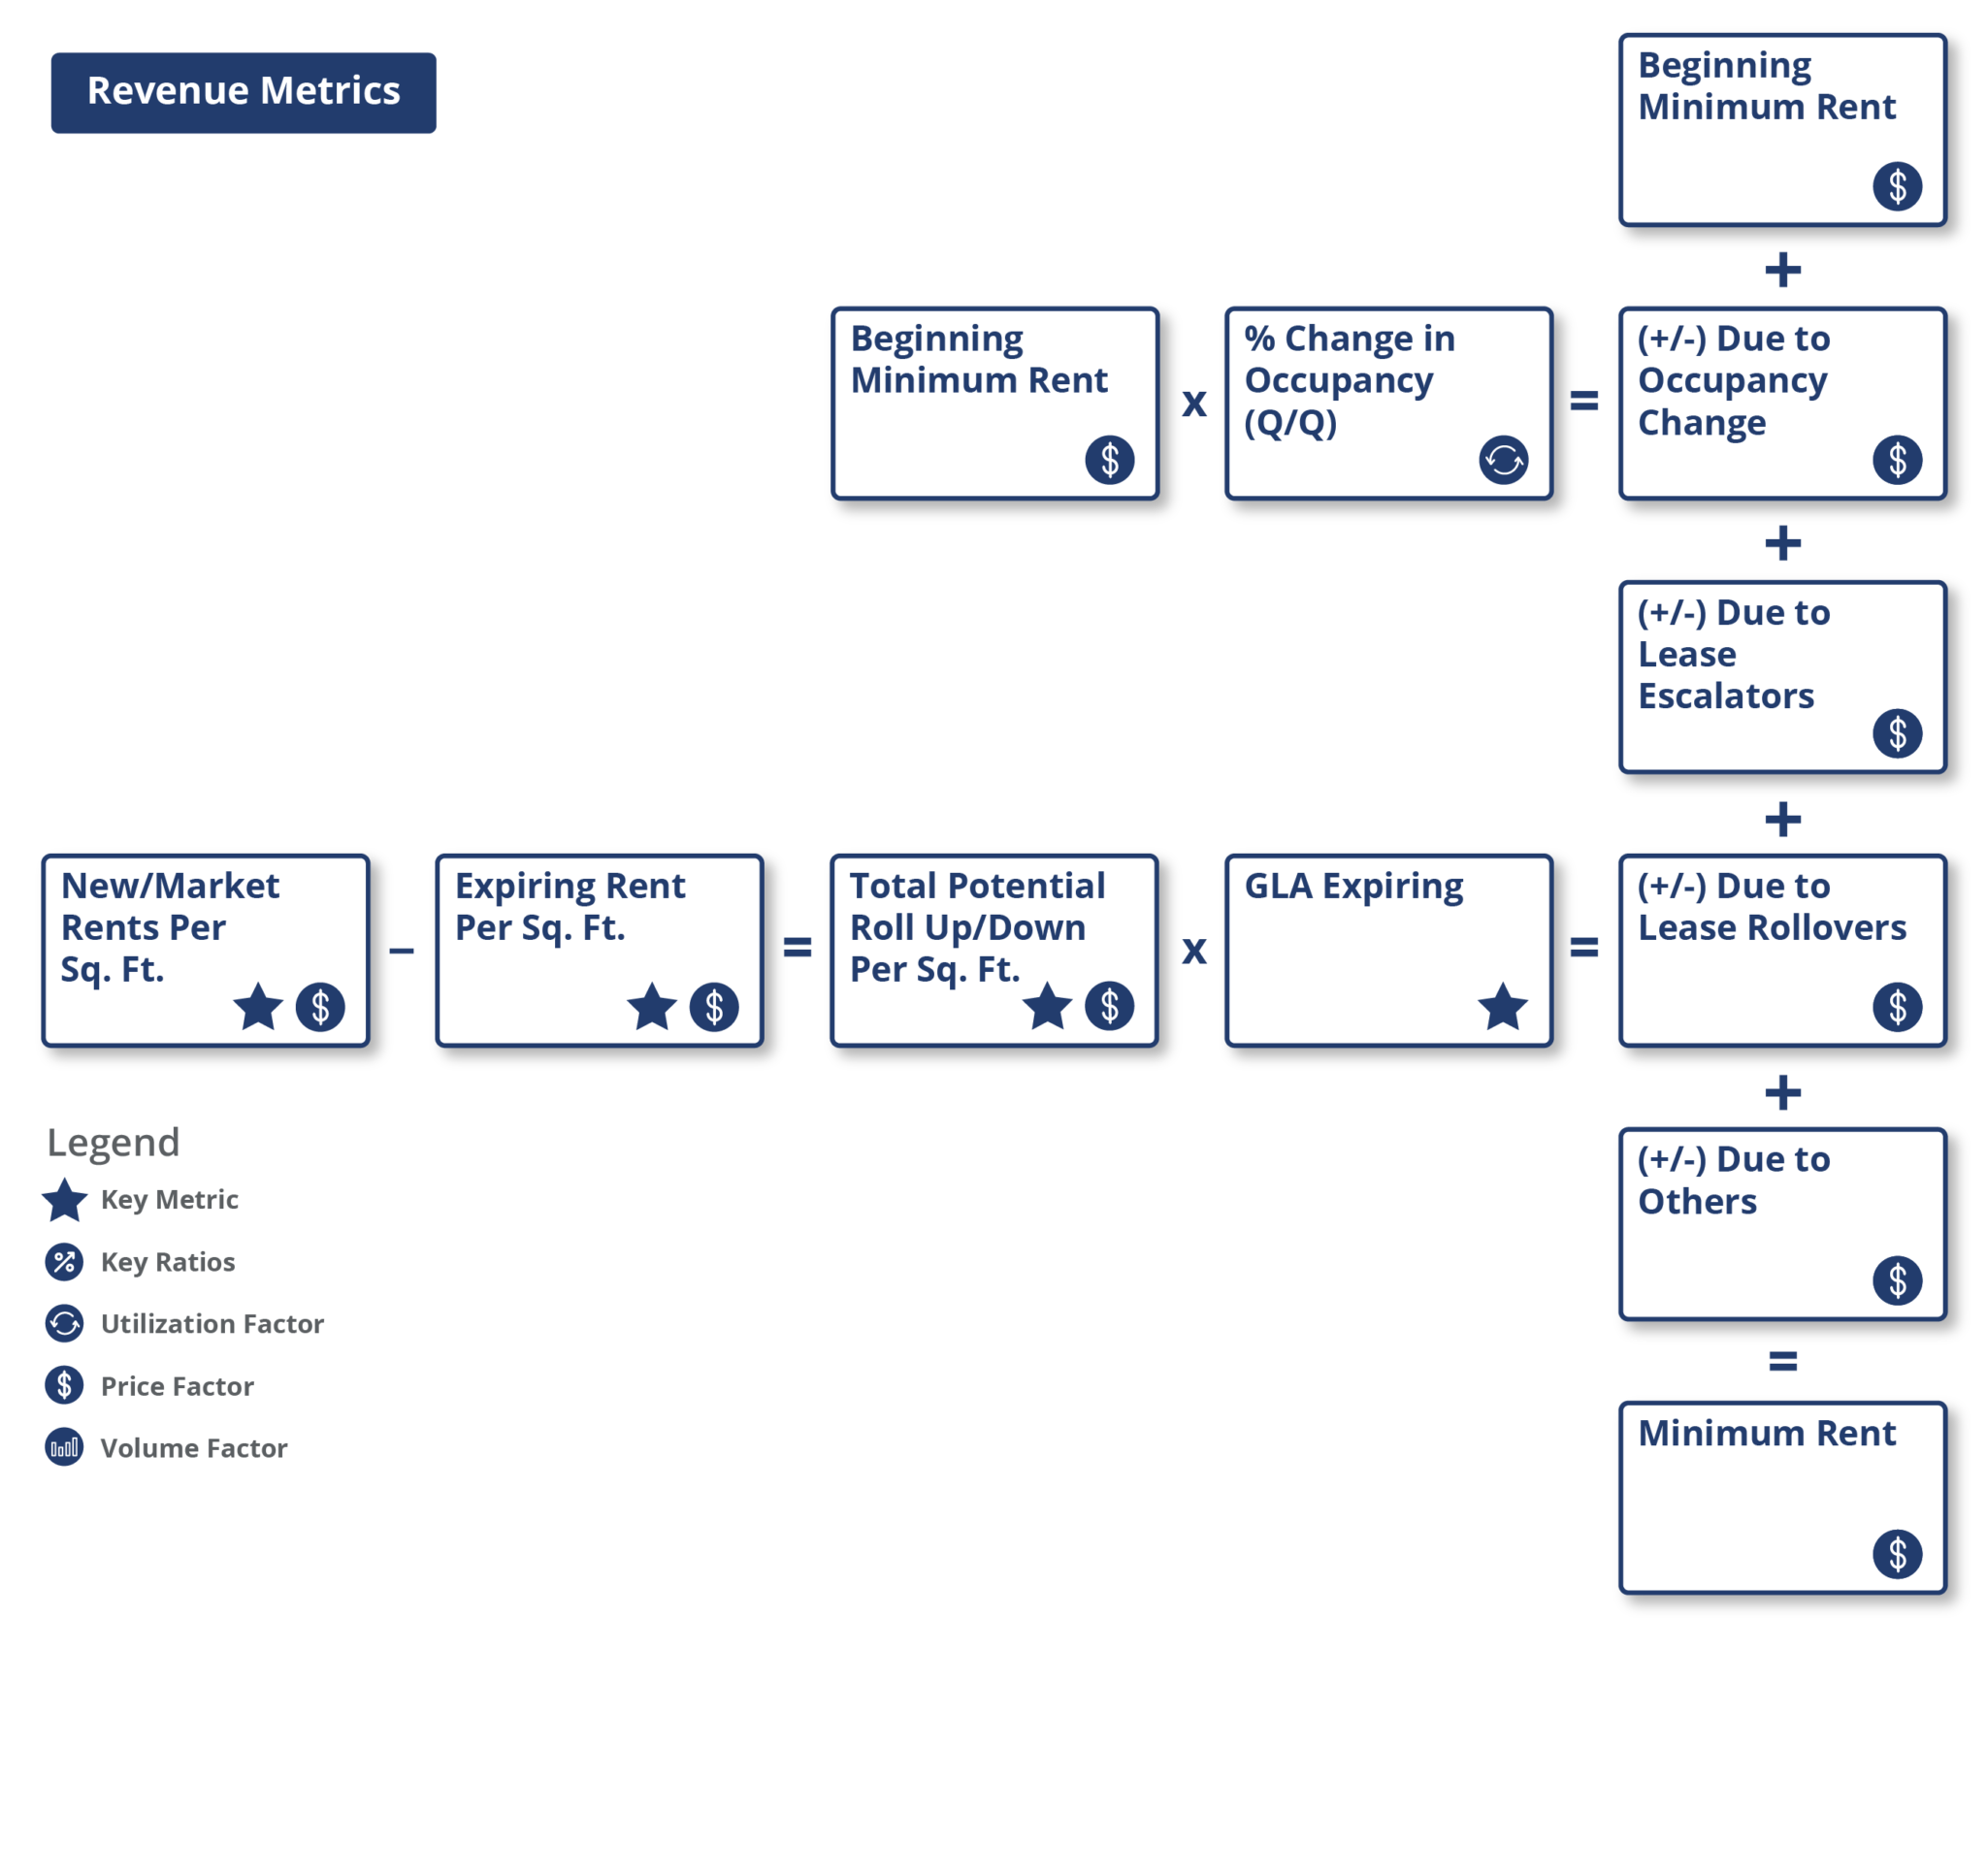
- New/Market Rent Per Sq. Ft.
- Expiring Rent Per Sq. Ft.
- Total Potential Roll Up/Down Per Sq. Ft.
- Square Feet Of Expiring Lease (K) aka GLA Expiring
- Acquisition Rate
- Acquisition Volume
- Development Volume
- Disposition Volume

Retail REITs Industry Business Model
-
Expenses
-
Revenue
-
Other Key Items & Ratios
Total rental expenses: REITs incur expenses to operate the portfolio of properties they hold. These expenses are is classified into four main categories:
- Property operating expenses – Property operating expenses are ongoing costs associated with operating a rental property. These are the costs that affect the daily operations of a REIT’s property and are crucial to maintaining the revenue stream of a retail REIT.
- Real estate taxes – Real estate taxes are taxes paid on the property owned by a REIT company.
- Property maintenance and repair expenses – These are expenses related to repairs and maintenance of the real estate property, management fees, utilities, and insurance costs.
- Capital expenditures (Capex) – REIT is a capital-intensive industry that requires a substantial amount of capex for the development and redevelopment of a property. This makes capex a major expense for a REIT company.
Retail REITs generate revenue by leasing retail properties to tenants, who pay rent either monthly, quarterly, or annually to the REIT company on a square per-foot basis. Revenue generated by retail REITs can be classified into several categories depending on the type of contract agreement between the retail tenant and the landlord (REITs). These categories include:
- Minimum rents – Minimum rent also referred to as basic rent of a commercial lease is the minimum initial rent paid by the retail tenants. This is due to the REIT every month, based on the square per foot of the leased space. Minimum rents are sometimes accretionary in nature, that is, increasing each year throughout the term of the lease, depending on the lease period and the agreed terms and conditions.
- Tenant reimbursements – Tenant reimbursements, sometimes referred to as tenant recoveries, are expenses paid back to a REIT by its retail tenants. These include property maintenance and repair costs, property insurance, property tax, and other operational expenses, among others. In the case of net lease, the tenant bears all of these expenses and pays a net rent to the landlord.
- Percentage rents – Percentage rent is a type of rent payment structure in commercial real estate where the retail tenant’s rent is calculated as a percentage of sales rather than a fixed monthly or annual amount, in addition to minimum rent.
Investors in retail REITs evaluate the profitability of REIT companies by looking at net operating income (NOI), funds from operations (FFO), and adjusted funds from operations (AFFO).
- Net operating income (NOI) – NOI is a measure of the profitability of a REIT company, after deducting all expenses associated with operating and maintaining the properties that a REIT company manages.
- Funds from operations (FFO) – FFO is useful to investors in measuring the operating and financial performance of a REIT company. It is calculated as net income applicable to common stockholders excluding non-cash adjustments.
- FFO payout ratio – FFO payout ratio helps investors understand dividend payments as a percentage of earnings. It is calculated by dividing total dividends paid with funds from operations (FFO).
- Adjusted funds from operations (AFFO) – AFFO is a financial measure used to estimate the value of a REIT. It is calculated as FFO minus capital expenditures and maintenance capex.
- AFFO payout ratio – AFFO payout ratio helps investors understand dividend payments as a percentage of earnings. It is calculated as total dividends paid during a given period, divided by adjusted funds from operations (AFFO) in the same period.
- Finally, investors also monitor debt / assets and debt / equity ratios to analyze investment efficiency and leverage.
Available Comp Tables - Consensus Estimates
Visible Alpha offers 9 Retail REITs-related comp tables, comparing forecasts for key financial and operating metrics, to make it easy to quickly conduct relative analysis, whether you are interested in looking at key values for global retail REITs, Americas or Europe. Every pre-built, customizable comp table is based on region, sub-industry, or key operating metrics.

Global Financial and Operating KPIs Company Examples:
North America
- Simon Property Group (SPG_US)
- REGENCY CENTERS CORP (REG_US)
- KITE REALTY GROUP TRUST (KRG_US)
- KIMCO REALTY CORPORATION (KIM_US)
- RAMCO-GERSHENSON PROPERTIES TRUST (RPT_US)
EMEA
- Deutsche Euroshop AG (DEQGN_DE)
- Carmila (CARM_FP)
- Mercialys SA (MERY_FR)
- Unibail-Rodamco-Westfield SE (URW_FR)
- Klepierre (LOIM_FR)
LATIN AMERICA
- Iguatemi Empresa de Shopping Centers SA (IGTA3_BR)
- Aliansce Shopping Centers (XAHPF_BR)
- BR Malls Participacoes SA (BRML3_BR)
ASIA
- IFortune REIT (0778_HK)
- The Link REIT (0823_HK)
- Frasers Centrepoint Trust (FCRT_SG)
Download Report
This guide highlights the key performance indicators for the retail REITs industry and where investors should look to find an investment edge, including:
- Retail REITs Industry Business Model & Diagram
- Key Retail REITs Metrics PLUS Visible Alpha’s Standardized Industry Metrics
- Available Comp Tables
- Industry KPI Terms & Definitions