


Guide to Restaurant Industry KPIs
This guide highlights the key performance indicators for the restaurants & bars industry and where investors should look to find an investment edge.
Industry Overview
The restaurants & bars industry is made up of companies whose primary business activities are focused on preparing and serving food or beverages to customers. While most of these companies serve on-premise food, off-premise is increasingly becoming a larger portion of their business, especially with the impact of Covid-19 on dining behavior.
Key Restaurants & Bars Metrics
Key performance indicators (KPIs) are the most important business metrics for a particular industry. When understanding market expectations for restaurants & bars, whether at a company or industry level, here are some of the KPIs to consider:
- Same Store Sales Growth
- Same Store Traffic Growth
- Same Store Ticket Growth
- New Store Unit Growth
- Restaurant Margin
- Operating Margin

Restaurants & Bars Business Model
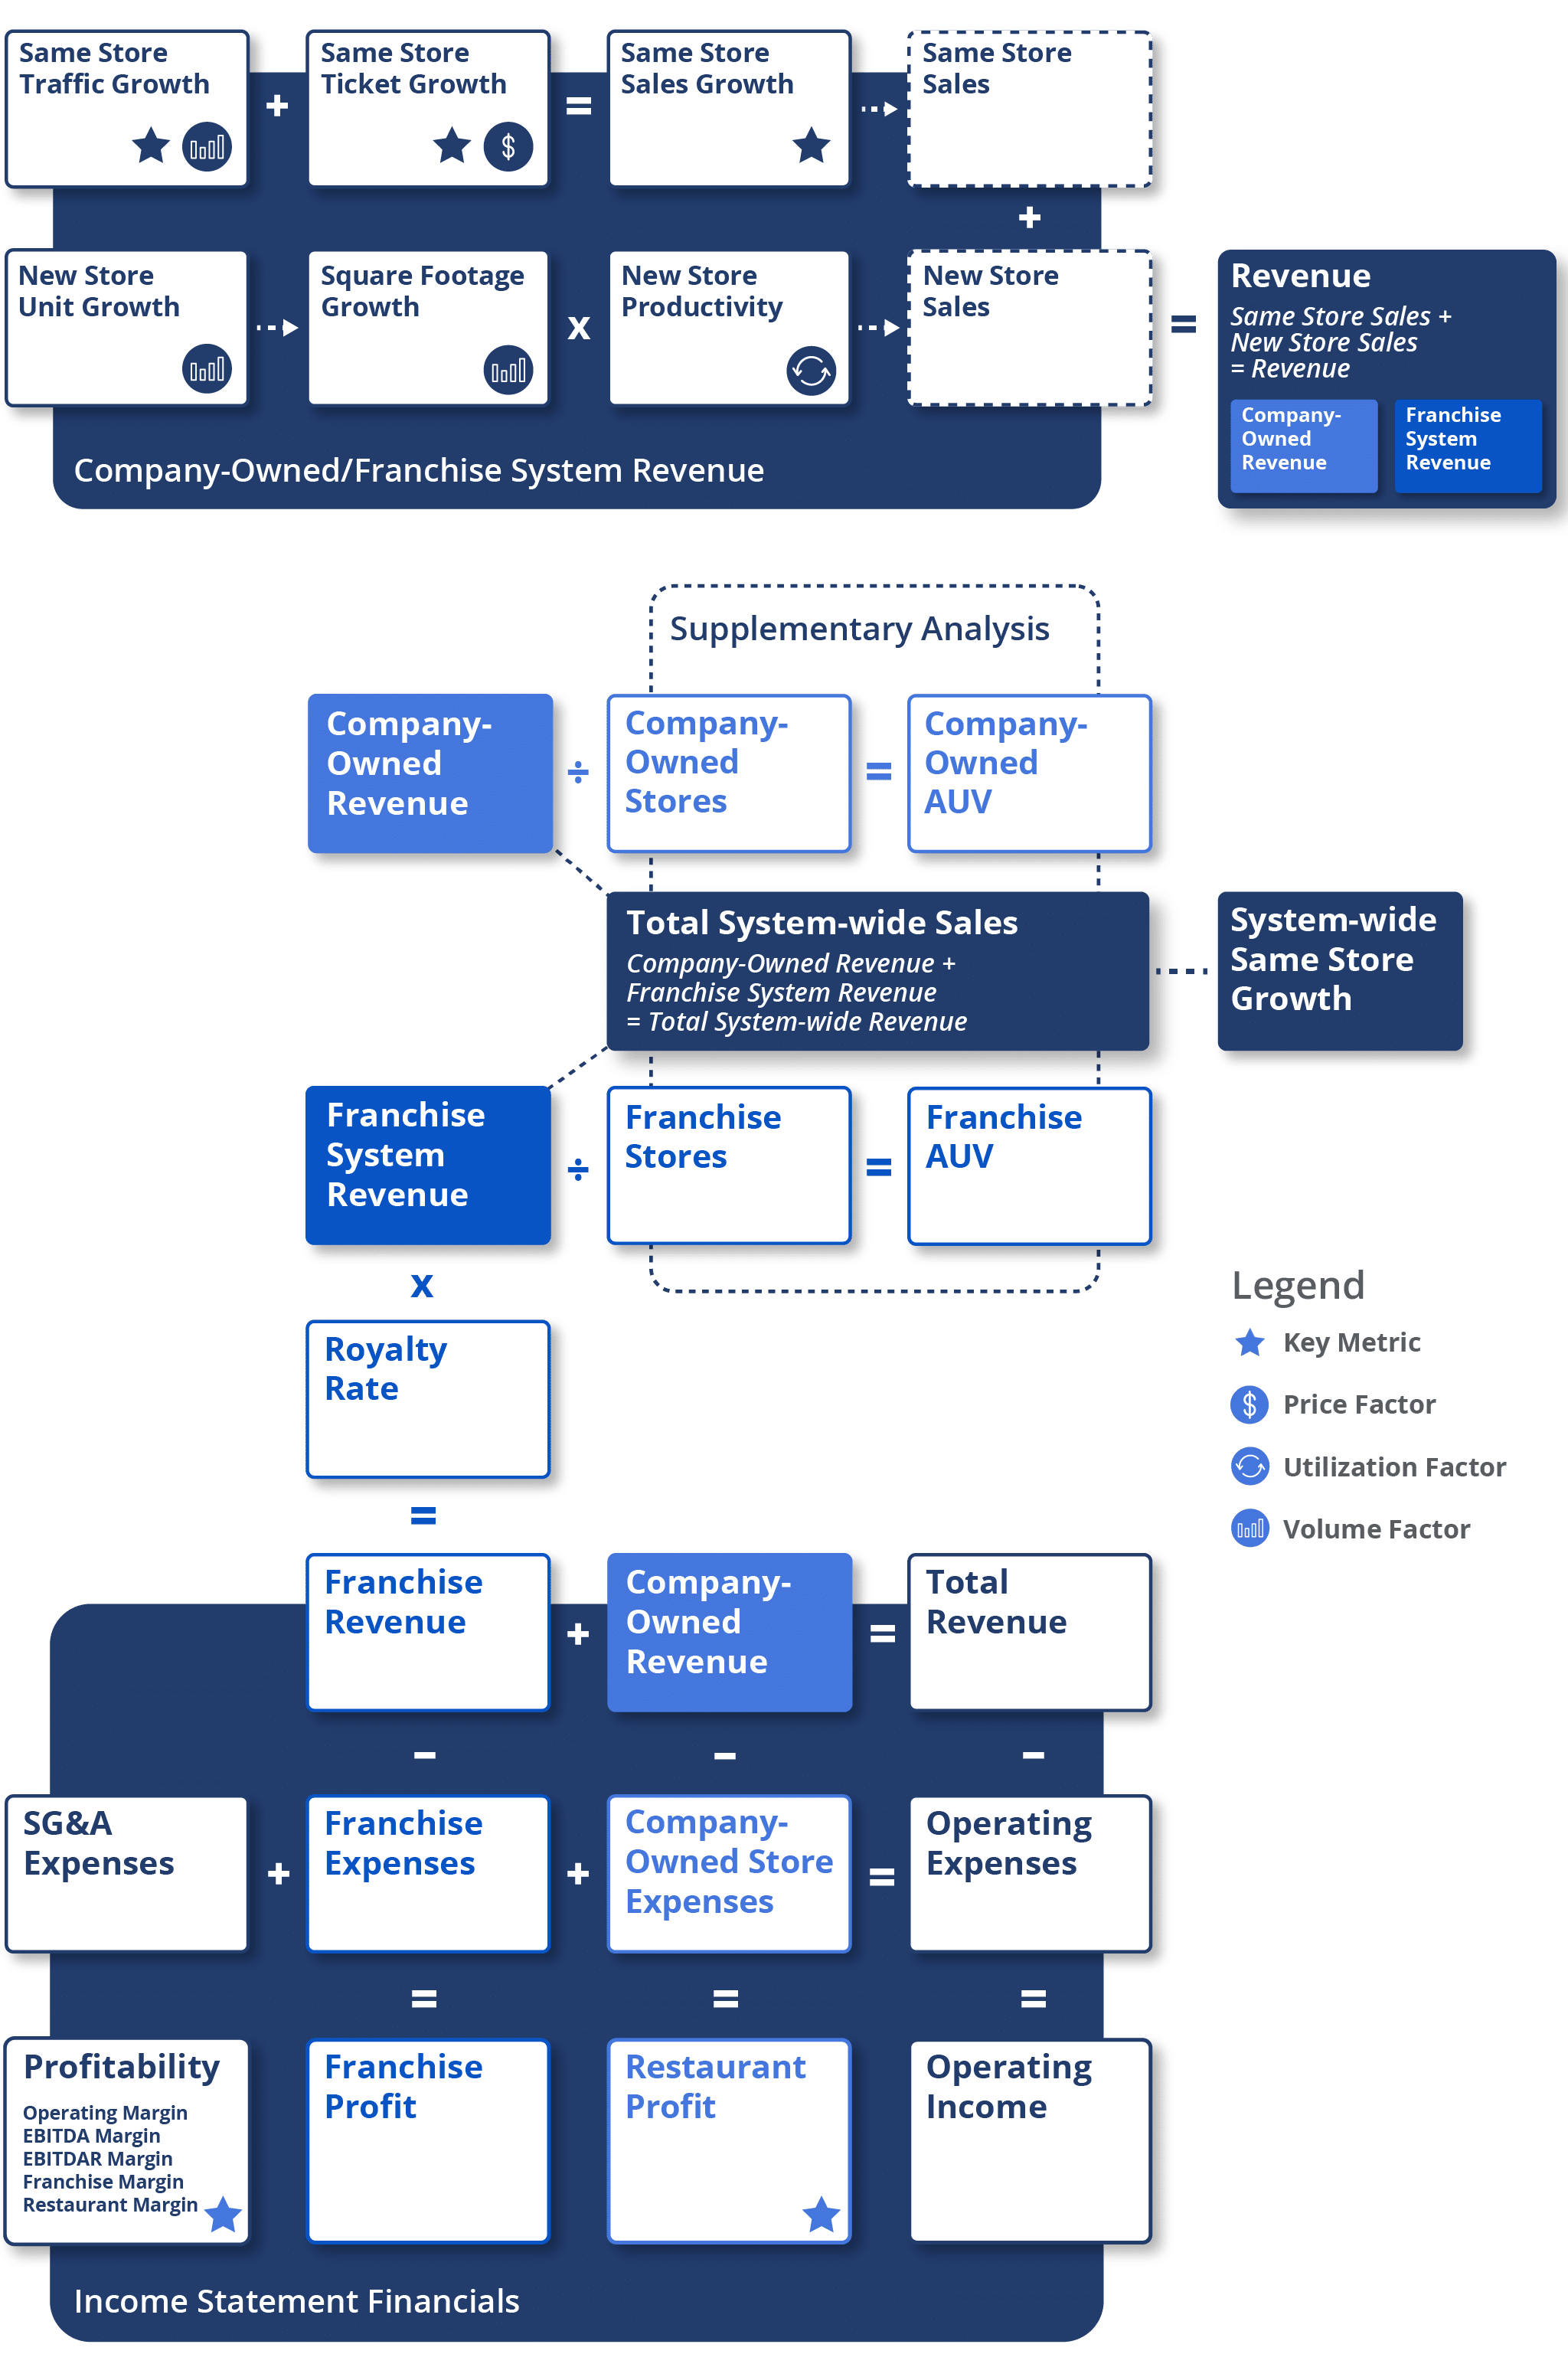
Restaurants generally have company-owned restaurants and franchised restaurants. Modeling both types of stores can look very similar, depending on the completeness of disclosures from the company. For both types of stores, investors often divide the entire store base into two buckets: one devoted to stores that have been open for 12 months or longer – called “same stores” – and the other for stores that have opened within the last 12 months – called “new stores.”
Same stores are scrutinized heavily as their trends are considered to be more representative of the underlying trends of the company as a whole. Same store sales growth is a key metric and measures sales growth among stores open 12 months or longer. Same store sales growth can be broken down into two general components: same store traffic (the number of people coming into the stores) and same store ticket (the spending per customer).
New stores are calculated by measuring the expansion of the retail footprint and multiplying by new store productivity. Expansion can be measured by store growth, or more precisely, by square footage growth. New store productivity measures a new store’s performance in its first year as a percentage of a same store; reaching 100% would equate to similar performance to a same store.
Together, same store sales and new store sales equals total sales. This same calculation can be similarly repeated for both company-owned and franchise stores. The primary difference comes from the fact that the company does not own the franchise stores, and therefore does not recognize all of a franchise store’s sales. For franchise stores, the sum of same stores and new stores equals total franchise system-wide sales. Franchise system-wide sales are then multiplied by the royalty rate to arrive at the total franchise revenue that the company recognizes on their income statement. Total franchise revenue (the royalties) plus total revenue from company-owned stores equals total revenue for the company.
For expenses, there are three main buckets to consider: expenses tied to running the company-operated stores, expenses tied to supporting franchise stores and SG&A expenses for the company as a whole. These buckets generally make up the operating expenses for a restaurant. Total revenue minus these total operating expenses equals the operating income for restaurants. Investors can also analyze the profitability of each segment by subtracting franchise expenses from the franchise revenue and company-owned expenses from the company-owned revenue to arrive at franchise margin and restaurant margin, respectively.
Available Comp Tables - Consensus Estimates
Visible Alpha offers 10 restaurant & bars comp tables that compare forecasts for key financial and operating metrics to make it easy to quickly conduct relative analysis on quick service, fast casual, casual dining, limited service or full service restaurants. Every pre-built, customizable comp table is based on region, sub-industry or key operating metrics.

Global Financial and Operating KPIs Company Examples:
AMER
- Chipotle Mexican Grill (CMG)
- McDonald’s Corporation (MCD)
- Alsea (ALSEA MX)
- YUM! Brands (YUM)
- Restaurant Brands International (QSR)
EMEA
- The Restaurant Group (RTN)
- JD Wetherspoon (JDW)
- Autogrill (ATGSF)
- Greggs (GRG)
- Mitchells & Butlers (MAB)
APAC
- ubilant FoodWorks (JUBI)
- HaiDiLao International (VA: 6862_CN / OTCMKTS: HDALF)
- Jollibee (JFC)
- Xiabu Xiabu Catering Management Co. (520 HK)
- Gourmet Master Co. (2723 TW)
Download Report
This guide highlights the key performance indicators for the restaurant industry and where investors should look to find an investment edge, including:
- Restaurant Industry Business Model & Diagram
- Key Restaurant Metrics PLUS Visible Alpha’s Standardized Industry Metrics
- Available Comp Tables
- Industry KPI Terms & Definitions