


Guide to Railroad Industry KPIs
This guide highlights the key performance indicators for the railroad industry and where investors should look to find an investment edge.
Industry Overview
These commodities include agricultural and food products, chemicals, plastics, petroleum, automotive, forest products, metallic ores, metals, and minerals. Globally, coal is also a major commodity transported by the railroad industry. Depending on the goods being transported, different types of freight cars are used, including boxcars, covered hoppers, open-top hoppers, tank cars, and/or gondolas.
Companies in the railroad industry are cyclical in nature and as a result, are sensitive to business cycles. An up or downturn of economic activity directly impacts the demand for rail services. A boom in industrial activity and the resulting increase in trade leads to an increased demand for transportation and rail services. Alternatively, increased interstate trade through rails enables access to previously difficult-to-obtain products, thereby increasing product demand as the market expands and promoting economic growth. These factors combined make the rail industry a good indicator of industrial and economic trends. It is also important to note that railroads, due to their involvement in goods transport, are a vital part of the supply chain for many industries.
In the transportation industry, rails compete with other freight enablers such as trucks, ships, barges, and pipelines (for crude oil). The competition varies widely, depending on the route and the freight category being transported. Trucks have an advantage on shorter routes given their speed and flexibility, while rails have an upper edge on the long hauls, given their ability to transport bulk freight. Railroads are also preferred in the case of fixed delivery networks or routes. From a cost and energy-efficiency perspective, moving freight by rails reduces cost as rails consume less fuel compared to trucks. This makes rails a viable mode of transport in a high fuel price environment. Apart from the cost factor – which is not the only deciding factor when selecting a mode of transport – rails are preferred also because of the shorter time-in-transit and the reliability they provide.
Trucks, airlines, and barges operate on highways, airways, and waterways that are financed by taxpayers and the government. In contrast, companies in the railroad industry operate almost exclusively on an infrastructure that they own, build, maintain and pay for, by themselves with little or no government assistance.
Key Railroad Industry Metrics
Key performance indicators (KPIs) are the most important business metrics for an industry. When understanding market expectations for railroads, whether at the company or the industry level, these are some of the railroad KPIs to consider:
- Carloads
- Revenue Per Carload
- Revenue Ton-Miles (RTM)
- Revenue Per Revenue Ton-Mile
- Gross Ton-Miles (GTM)
- Total RTM / GTM
- Operating Ratio

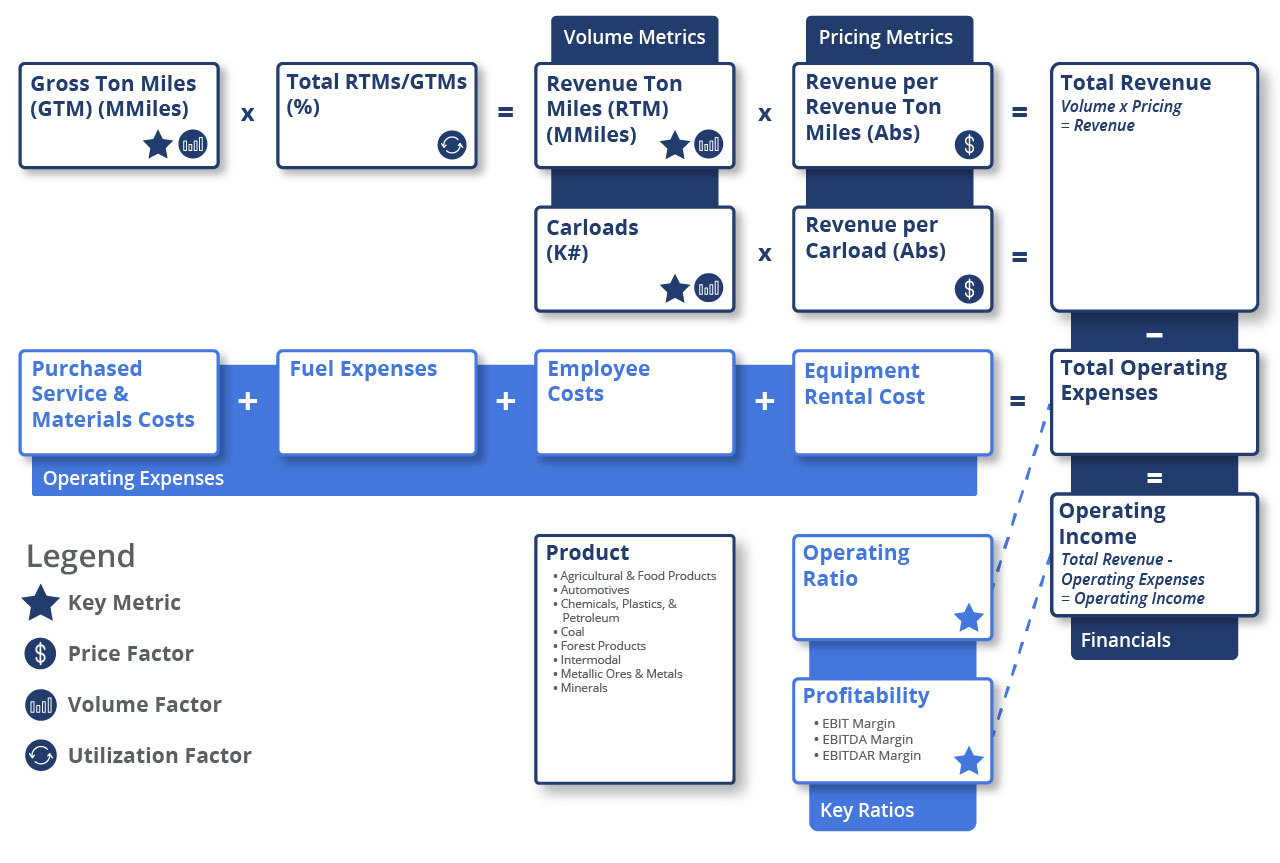
Railroad Industry Business Model
-
Revenue
-
Commodities/Goods Transported by Railroads
-
Expenses
-
Profitability
Companies in the railroad industry use two methods to compute revenue:
- Carloads multiplied by revenue per carload; and
- Revenue ton-miles multiplied by revenue per revenue ton-miles
Each method is driven mainly by how the industry measures volumes. The calculation is done separately for each category of the commodity being transported and then added together to calculate the total revenue.
In the two methods, both carload and revenue ton-miles represent volume. Carload is the quantity of freight loaded on a railcar given its weight-bearing or space-carrying capacity. Revenue ton-miles refer to the movement of one revenue-producing ton of freight over a distance of one mile in a rail car.
Revenue per carload and revenue per revenue ton-mile on the other hand represent pricing. Revenue per carload is the amount of revenue earned for every carload moved. It is calculated by dividing the revenue for a commodity by the number of carloads of the commodity transported in a given period. Revenue per revenue ton-mile is the revenue earned for transporting one ton of freight across one mile.
Railroads transport enormous amounts of finished goods and raw materials such as:
- Agricultural products including grains, grain mill products, farm, and food products
- Chemicals such as ethanol, fertilizers, and plastic & petroleum including gasoline, kerosene distillate fuel oil, among others
- Coal including hard coal, black coal, and brown coal
- Forest products such as lumber and wood products, pulp, and other paper products
- Metallic ores and metals including iron, copper, zinc, among others
- Automotives include motor vehicles, passenger car bodies, motor bus or truck bodies, motor vehicle parts and accessories, truck trailers, and used vehicles
- Minerals such as crushed stone, sand, gravel, non-metallic minerals, stone, clay, and glass products
Note that intermodal transport uses multiple modes of transportation. It relies on the use of standardized containers/trailers that can be transferred from ship to rail to truck with no reloading or unloading of the freight itself.
Industries that drive volumes and revenue for railroad companies along with the commodities they transport include:
| Suppliers/Visible Alpha Industries | Commodities Transported |
|---|---|
| Agricultural products | Agricultural & food products |
| Auto manufacturers, auto parts, commercial vehicles & trucks | Automotives |
| Commodity chemicals, diversified chemicals, specialty chemicals | Chemicals, plastics & petroleum |
| Coal & consumable fuels, coal mining | Coal |
| Paper & forest products | Forest products |
| Trucking, delivery air freight & logistics | Intermodal |
| Metals & mining | Metallic ores & metals |
Labor costs, fuel expenses, purchased services & material costs and equipment rental costs are all important expenses for a railroad operator. A highly tracked efficiency ratio for expenses in the railroad industry is the operating ratio and it is calculated by dividing the total operating expense by the total revenue.
The most important expense for a railroad company is employee cost followed by depreciation and amortization expense and purchased services and material costs.
Capital Expenditure (CapEx): Railroads have a complex infrastructure to maintain and upgrade which includes:
- Track structure
- Bridges, culverts, tunnels
- Signal and communications systems
- Locomotive and freight car maintenance and/or replacements
Over the last several years, the CapEx/depreciation ratio of railroad companies has seen a downward trend, indicating that the railroad industry is not delaying its track structure expansion (capacity projects), replacement (program projects), and replacement of locomotive/freight cars.
The profitability of a company in the railroad industry can be gauged by looking at the earnings before interest & taxes (EBIT), earnings before interest, taxes, depreciation & amortization (EBITDA) and earnings before interest, taxes, depreciation, amortization & restructuring or rent costs (EBITDAR). EBITDA is an important metric given the industry’s high depreciation and amortization costs, while EBITDAR is analyzed to normalize the differences arising from each company using different accounting standards for their rent expenses.
Available Comp Tables - Consensus Estimates
Visible Alpha offers comp tables, comparing forecasts for key financial and operating metrics, to make it easy to quickly conduct relative analysis. Every pre-built, customizable comp table is based on region and/or key operating metrics.

Global Financial and Operating KPIs Company Examples:
North America
- CSX Corp (CSX)
- Union Pacific Corp (UNP)
- Canadian Pacific Railway (CNP)
- Norfolk Southern Corp (NSC)
- Canadian National Railway Company (CNI)
- Kansas City Southern (KSU)
International
- Aurizon Holdings Limited (AZJ_AU)
- Rumo SA (RAIL3_BR)
- GMexico Transportes SAB de CV (GMXT_MX)
- Daqin Railway (601006_CN)
- Guangshen Railway (601333_CN)
Download Report
This guide highlights the key performance indicators for the railroad industry and where investors should look to find an investment edge, including:
- Railroad Industry Business Model & Diagram
- Key Railway Industry Metrics PLUS Visible Alpha’s Standardized Industry Metrics
- Available Comp Tables
- Industry KPI Terms & Definitions