


Guide to Power Generation Industry KPIs
This guide highlights the key performance indicators for the power generation industry and where investors should look to find an investment edge.
Industry Overview
The electric utility industry is divided into three segments: power generation or the business of producing electricity; transmission, which involves the bulk movement of the electrical energy from a generating site to electrical substations where voltage is transformed; and distribution, which involves supplying electricity to the end consumers through power lines.
Large energy companies often operate in all three segments as it is more cost-effective, while smaller companies tend to operate in only one of these segments. In this guide, we primarily focus on the first segment of the electric utility sector’s value chain: power generation.
Power generation is the business of generating electricity in power plants or power stations, from primary sources of energy. A power plant contains one or more power generators, which are rotating machines that convert mechanical energy into electrical energy using renewable or non-renewable energy sources. Renewable energy sources include wind, solar power, hydropower, geothermal, and biomass energy. Non-renewable energy includes coal, nuclear energy, natural gas, and oil. Most power generation companies have a portfolio comprising both non-renewable and renewable energy sources.
Coal and natural gas are the most commonly used energy sources in electricity generation. The heat from burning coal produces steam that moves the blades of the turbines inside the power plant, producing electricity. Coal power plants are the largest source of electricity generation and the single largest source of energy-related CO2 emissions. Nuclear power is considered to be one of the cleanest forms of energy amongst fossil fuels. Nuclear power plants use reactions from nuclear fission to produce electricity. Renewable energy sources such as solar, wind, and hydropower use sunlight, wind force, and the movement of water to produce electricity. A major challenge with renewable energy sources like solar and wind is that they are intermittent in nature. Energy storage technology is gradually getting cheaper and attracting investment as means of providing backup and will be critical for supporting the widespread deployment of renewable energy sources in the total power mix.
As the world considers ways of establishing a path toward limiting the rise in global temperatures and curbing emissions, the power generation industry has a central role to play. Recent policy commitments by major economies towards net-zero emissions have led to power generation companies investing aggressively in renewable energy.
Key Power Generation Industry Metrics
Key performance indicators (KPIs) are the most important business metrics for a particular industry. When understanding market expectations for the power generation industry, whether at a company or industry level, some KPIs to consider include:
- Volume - Electricity Generation (GWh)
- Volume - Electricity Generation, Renewable (GWh) (Solar, Wind, Hydro and Geothermal)
- Volume - Electricity Generation, Non-Renewable (GWh) (Coal, Oil/Gas, and Nuclear)
- Capacity - Electricity Generation (MW)
- Capacity - Electricity Generation, Renewable (GWh) (Solar, Wind, Hydro and Geothermal)
- Capacity - Electricity Generation, Non-Renewable (GWh) (Coal, Oil/Gas, and Nuclear)
- Capacity Factor - Electricity Generation, Renewable (%) (Solar, Wind, Hydro and Geothermal)

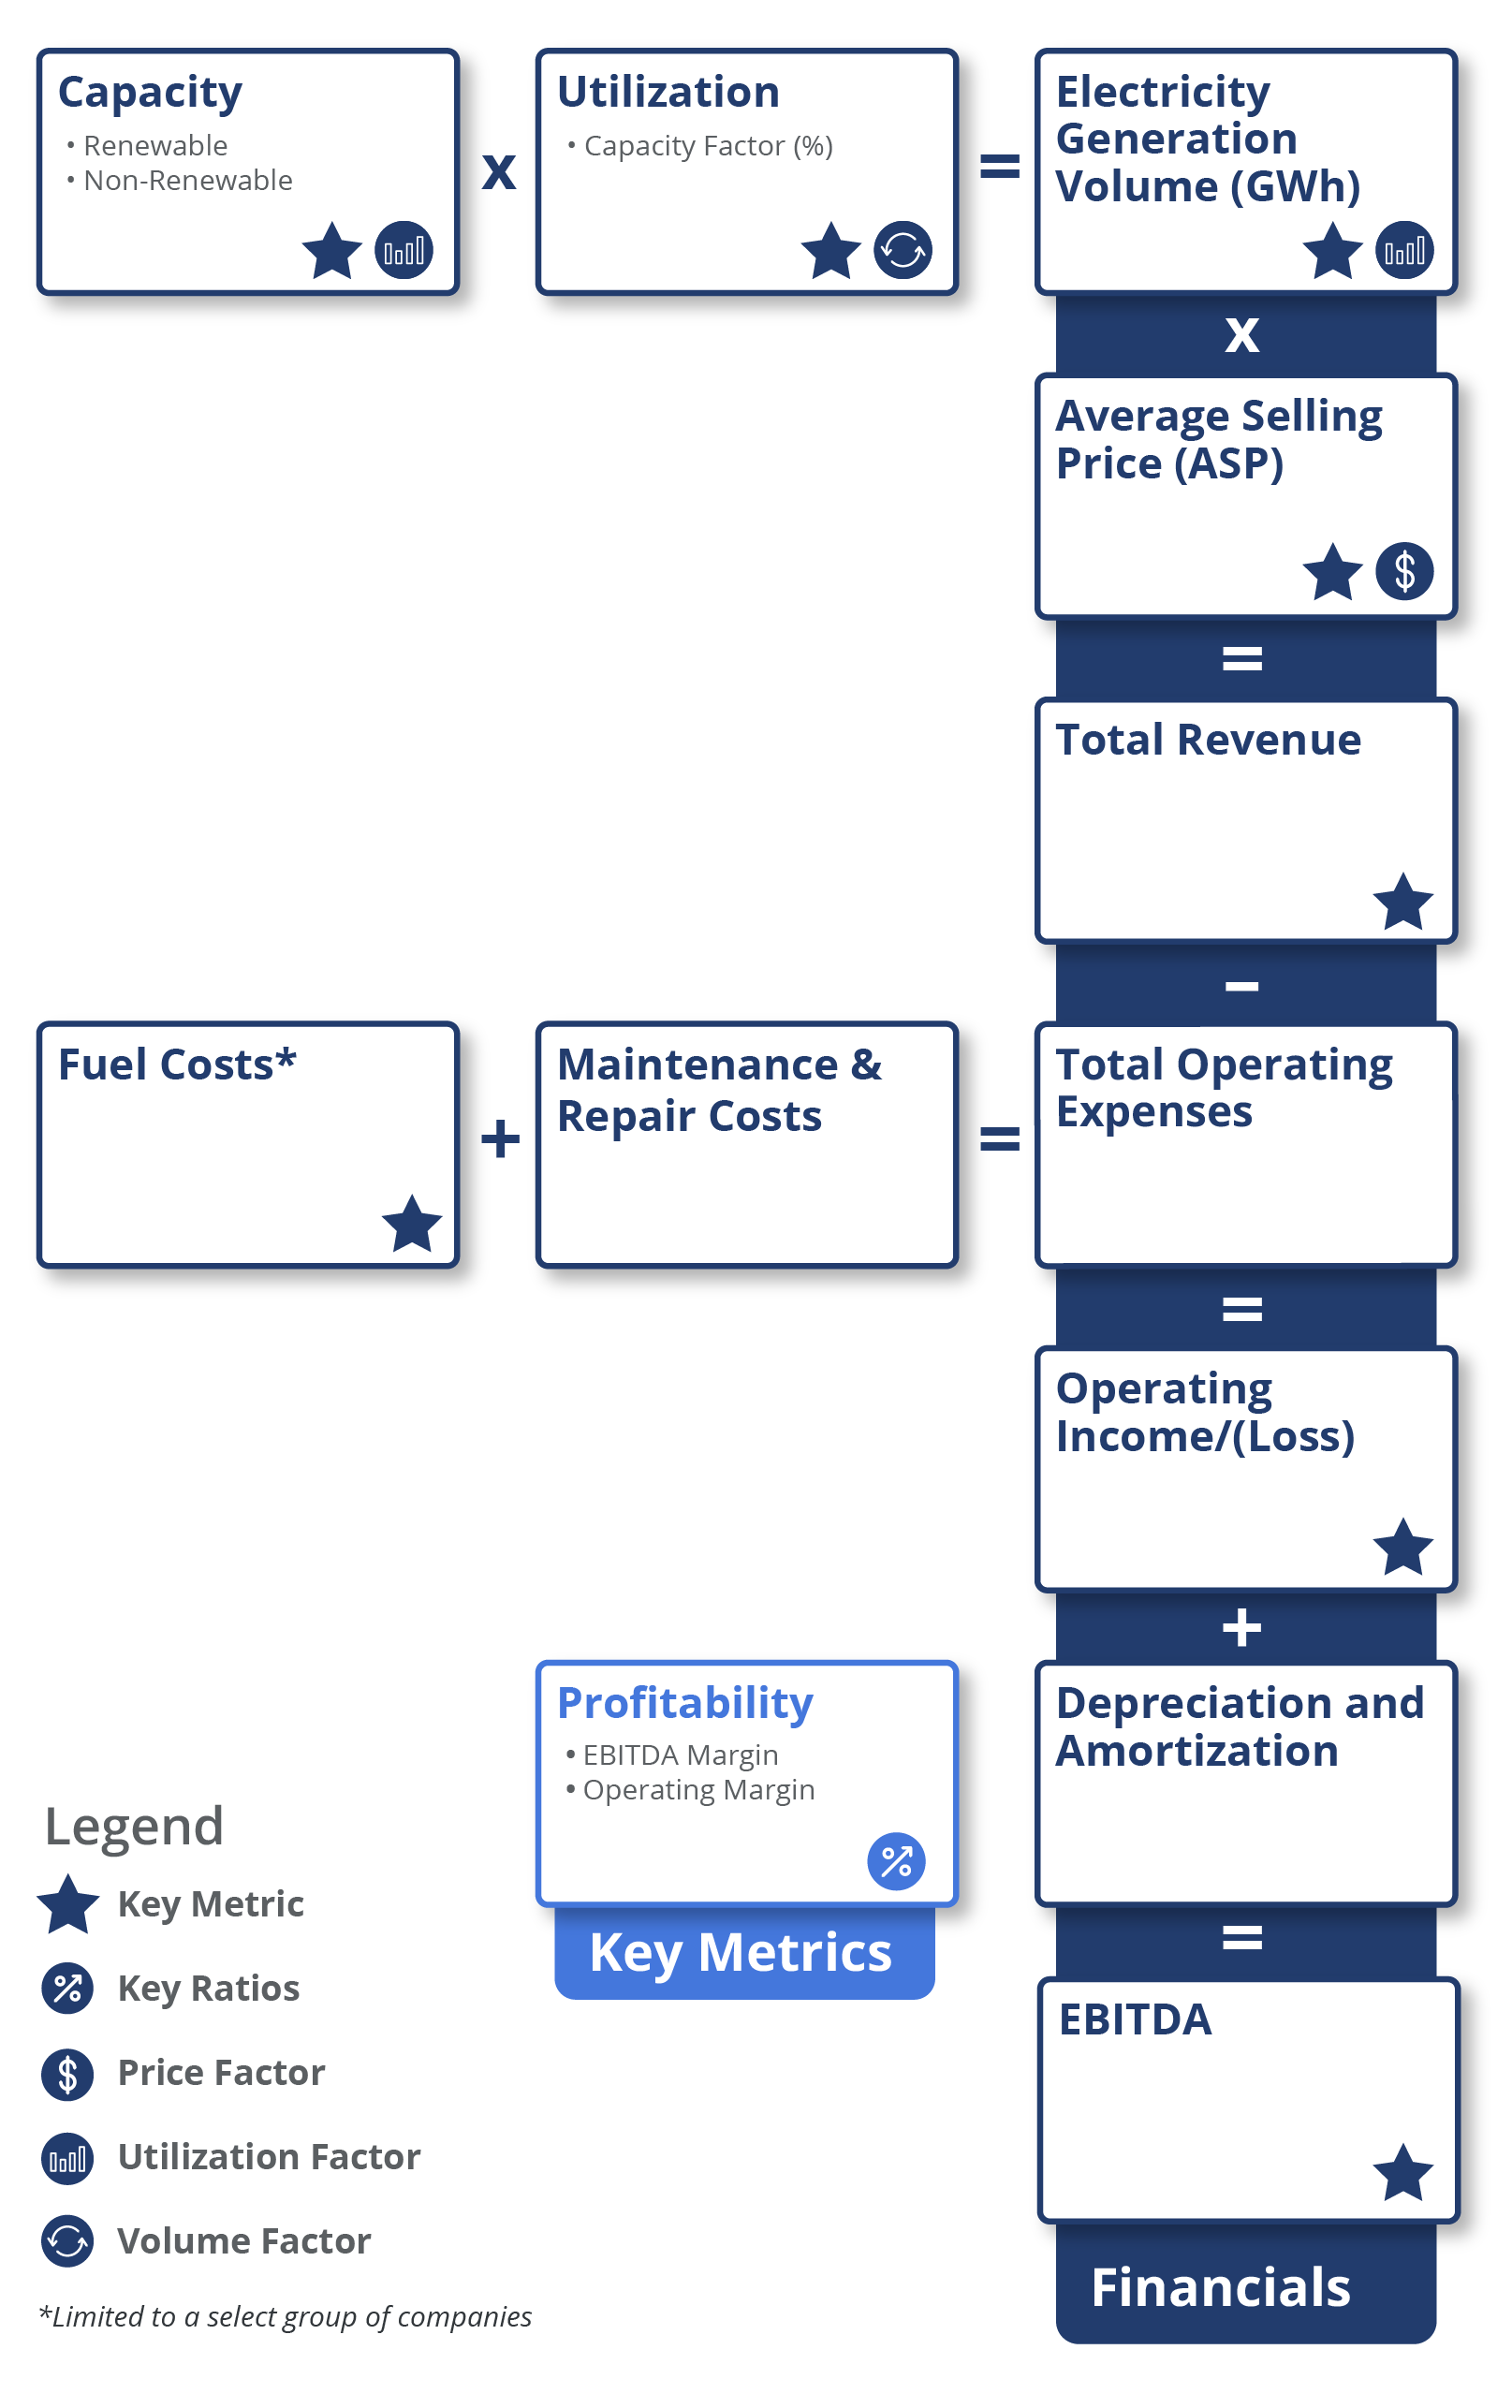
Power Generation Industry Business Model
-
Expenses
-
Revenue
-
Profitability
Cost structure analysis provides insights into a company’s ability to maintain margins and trends in ASPs for power generation. Fuel cost is a crucial expense for companies operating power plants using fossil fuels like coal and natural gas.
- Fuel cost – This is the cost associated with securing the source of fuel used in generating electricity by a power plant. In other words, it is the amount of fuel it costs to produce 1 KWh/MWh/GWh volume of electricity. Fuel cost is mainly seen in companies that run coal, natural gas, and nuclear-based power plants.
For a coal-based power plant, fuel cost = total quantity of coal used ✖ cost per quantity. The total quantity of coal = total volume (GWh) ✖ quantity of coal required per GWh.
Any changes in the benchmark prices of fuel affect fuel costs.
Power generation companies generate revenue by producing electricity (GWh) and then selling it to transmission and distribution companies at an average realized price ($/MWh). Transmission and distribution companies then sell this electricity to the end consumers at a regulated price depending on the local jurisdiction.
Volume and average selling price (ASP) are two important metrics when analyzing revenue for power generation companies. Volume sold is derived from capacity and capacity factor, or the capacity utilization of the power plants owned or operated by a power generation company.
Capacity is the power plant’s output when running at its maximum. Maximum output is typically measured in megawatts (MW) or gigawatts (GW). Capacity factor (%) represents the efficiency with which a power plant generates electricity. A power plant’s capacity factor is the ratio of actual output to the maximum possible output during a given period. A plant with a capacity factor of 100% produces power at all times. The capacity factor of power plants differs depending on the source of fuel or energy used.
A nuclear power plant is known to be the most efficient with capacity factors as high as 95%. Coal-powered plants, which are the most widely used, have capacity factors ranging between 40-60%. The capacity factors of wind and solar-powered plants depend on the availability and quality of sunlight and wind available. Capacity factor (%) for a year = (total volume per year (GWh)) ∕ ((total capacity(MW) ✖ 365 days ✖ 24 hours) ∕ 1000 ( ∕ 1000 to convert from MWh to GWh)).
The total volume sold (in MWh or GWh) by a power generation company is the product of total capacity (MW or GW) and the capacity factor (%) of all the power plants owned or operated by the company. To ensure comparability of KPIs for the power generation industry and given that volume sold is in GWh and capacity in MW, we use the following conversion: total volume (GWh) for a year = ((capacity (MW) ✖ 365 days ✖ 24 hours) ✖ capacity factor (%)) ∕ 1000.
ASP is the weighted average price of the volume of electricity sold by a power generation company. ASP is usually measured in MWh or KWh. Power generation companies sell a portion of the electricity they generate at a fixed price under long-term agreements (LTA) or purchase power agreements (PPA) to buyers for a long tenure. They also sell a portion of the electricity in the wholesale market at spot prices. Power generation companies operating in different countries are mandated to adhere to local regulations which impact ASP.
EBITDA (earnings before interest, taxes, depreciation, and amortization) is a key measure of profitability for analyzing companies in this industry. Energy or fuel-based EBITDA such as EBITDA – coal, natural gas, wind, and solar provides essential insights into the performance of the different fuel segments within and across companies. In the case of valuations of pure play power generation companies, analysts generally use discounted cash flow (DCF) based, sum-of-the-parts (SOTP) at the fuel type and geographical level. EV/EBITDA is another popular ratio used to value companies in this industry.
Available Comp Tables - Consensus Estimates
Visible Alpha offers one power generation-related comp table, comparing forecasts for key financial and operating metrics, to make it easy to quickly conduct relative analysis, whether you are interested in looking at key values for global companies, Americas, or Europe. Every pre-built, customizable comp table is based on region, sub-industry, or key operating metrics.

Global Financial and Operating KPIs Company Examples:
North America
- Constellation Energy Corporation (CEG_US)
- Nextera EnergyPartners (NEP_US)
- Algonquin Power & Utilities (AQN_CA)
- Capital Power (CPX_CA)
- Brookfield Renewable Partners LP (BEP_US)
EMEA
- Orsted AS (ORSTED_DK)
- CENTRICA PLC (CNA_UK)
- Electricite de France (EDF_FR)
- Energias de Portugal (EDP_PT)
- EDP Renovaveis (EDPR_PT)
APAC
- Huadian Power International (1071_CN)
- China Yangtze Power Co. (600900_CN)
- China Longyuan Power Group (916_CN)
- Xinyi Energy Holdings Limited (3868_CN)
- Huaneng Lancang River Hydropower Inc (600025_CN)
Download Report
This guide highlights the key performance indicators for the power generation industry and where investors should look to find an investment edge, including:
- Power Generation Business Model & Diagram
- Key Power Generation Industry Metrics PLUS Visible Alpha’s Standardized Industry Metrics
- Available Comp Tables
- Industry KPI Terms & Definitions