


Guide to Payment Processing Industry KPIs
This guide highlights the key performance indicators for the payment processing industry and where investors should look to find an investment edge.
Industry Overview
The payment processing industry comprises companies that facilitate electronic payment transactions between buyers and sellers, also known as merchants. Payment processing companies work with sellers or merchants, financial institutions, and other organizations to facilitate secure and efficient payment transactions, through credit or debit cards, electronic fund transfers, and online payments.
The payment processing ecosystem comprises a combination of players that interact with each other during a payment transaction process, including:
- Buyers or cardholders that initiate a payment transaction.
- Issuing banks that provide payment cards (credit and debit cards) to buyers on behalf of network-providing or card network companies.
- Card network companies that operate payment card networks such as Visa, Mastercard, and American Express. They provide the infrastructure for payment transactions to be routed between issuing and acquiring banks.
- Merchants or sellers that accept card or electronic payments from buyers. Merchants work with acquiring banks to apply for and receive a merchant account. In the payment processing industry, the customers are the merchants.
- Acquiring banks, also known as merchant acquirers, are financial institutions that process card payments on behalf of merchants and settle funds to the merchant account. Acquiring banks securely transmit card details of buyers through the card network for authentication from the issuing bank.
- Payment aggregators are intermediaries facilitating online payments, and connecting customers with merchants. They are third-party service providers that allow merchants to accept payments from customers by integrating them into their websites or apps.
- Payment gateways are software applications that allow the safe and secure transfer of money from the customer’s bank account to the merchant’s bank. A payment aggregator handles funds, while the gateway only provides the technology.
- Payment processors are authorized companies that process transactions between buyers and sellers.
Given that payment processing involves multiple players, the industry can be further classified into sub-industries including:
- Digital payment networks such as Apple Pay, Google Pay, Venmo, Square, and Zelle.
- Card networks such as Mastercard and Visa.
- Acquiring banks or merchant acquirers such as PayPal and Fiserv.
- B2B or corporate payment companies such as Fleetcor and Verra Mobility.
- Money transfer or international remittance services providers such as Wise, Remitly, and Western Union.
The payment processing industry is characterized by recurring revenues, high operating leverage, and robust free cash flow generation, driven by the continuing global shift from paper to electronic forms of payment.

Key Payment Processing Industry Metrics
Key performance indicators (KPIs) are an industry’s most important business metrics. When understanding market expectations for the payment processing industry, whether at a company or industry level, some KPIs to consider include:
- Numbers of Transactions
- Take Rate
- Processing Fee per Transaction / Revenue per Transaction
- Transaction Revenue
- Cost of Service / Revenue
- Research and Development (R&D) Expenses
- Operating Margin

Payment Processing Industry Business Model
-
Expenses
-
Revenue
-
Profitability
Payment processing companies typically incur several major expenses, including:
- Cost of service/revenue including transaction expenses
- Research and development (R&D) expenses
- Selling & marketing expenses
- Hardware costs
These expenses vary by company, and may also depend on the company’s size, revenue, and target market.
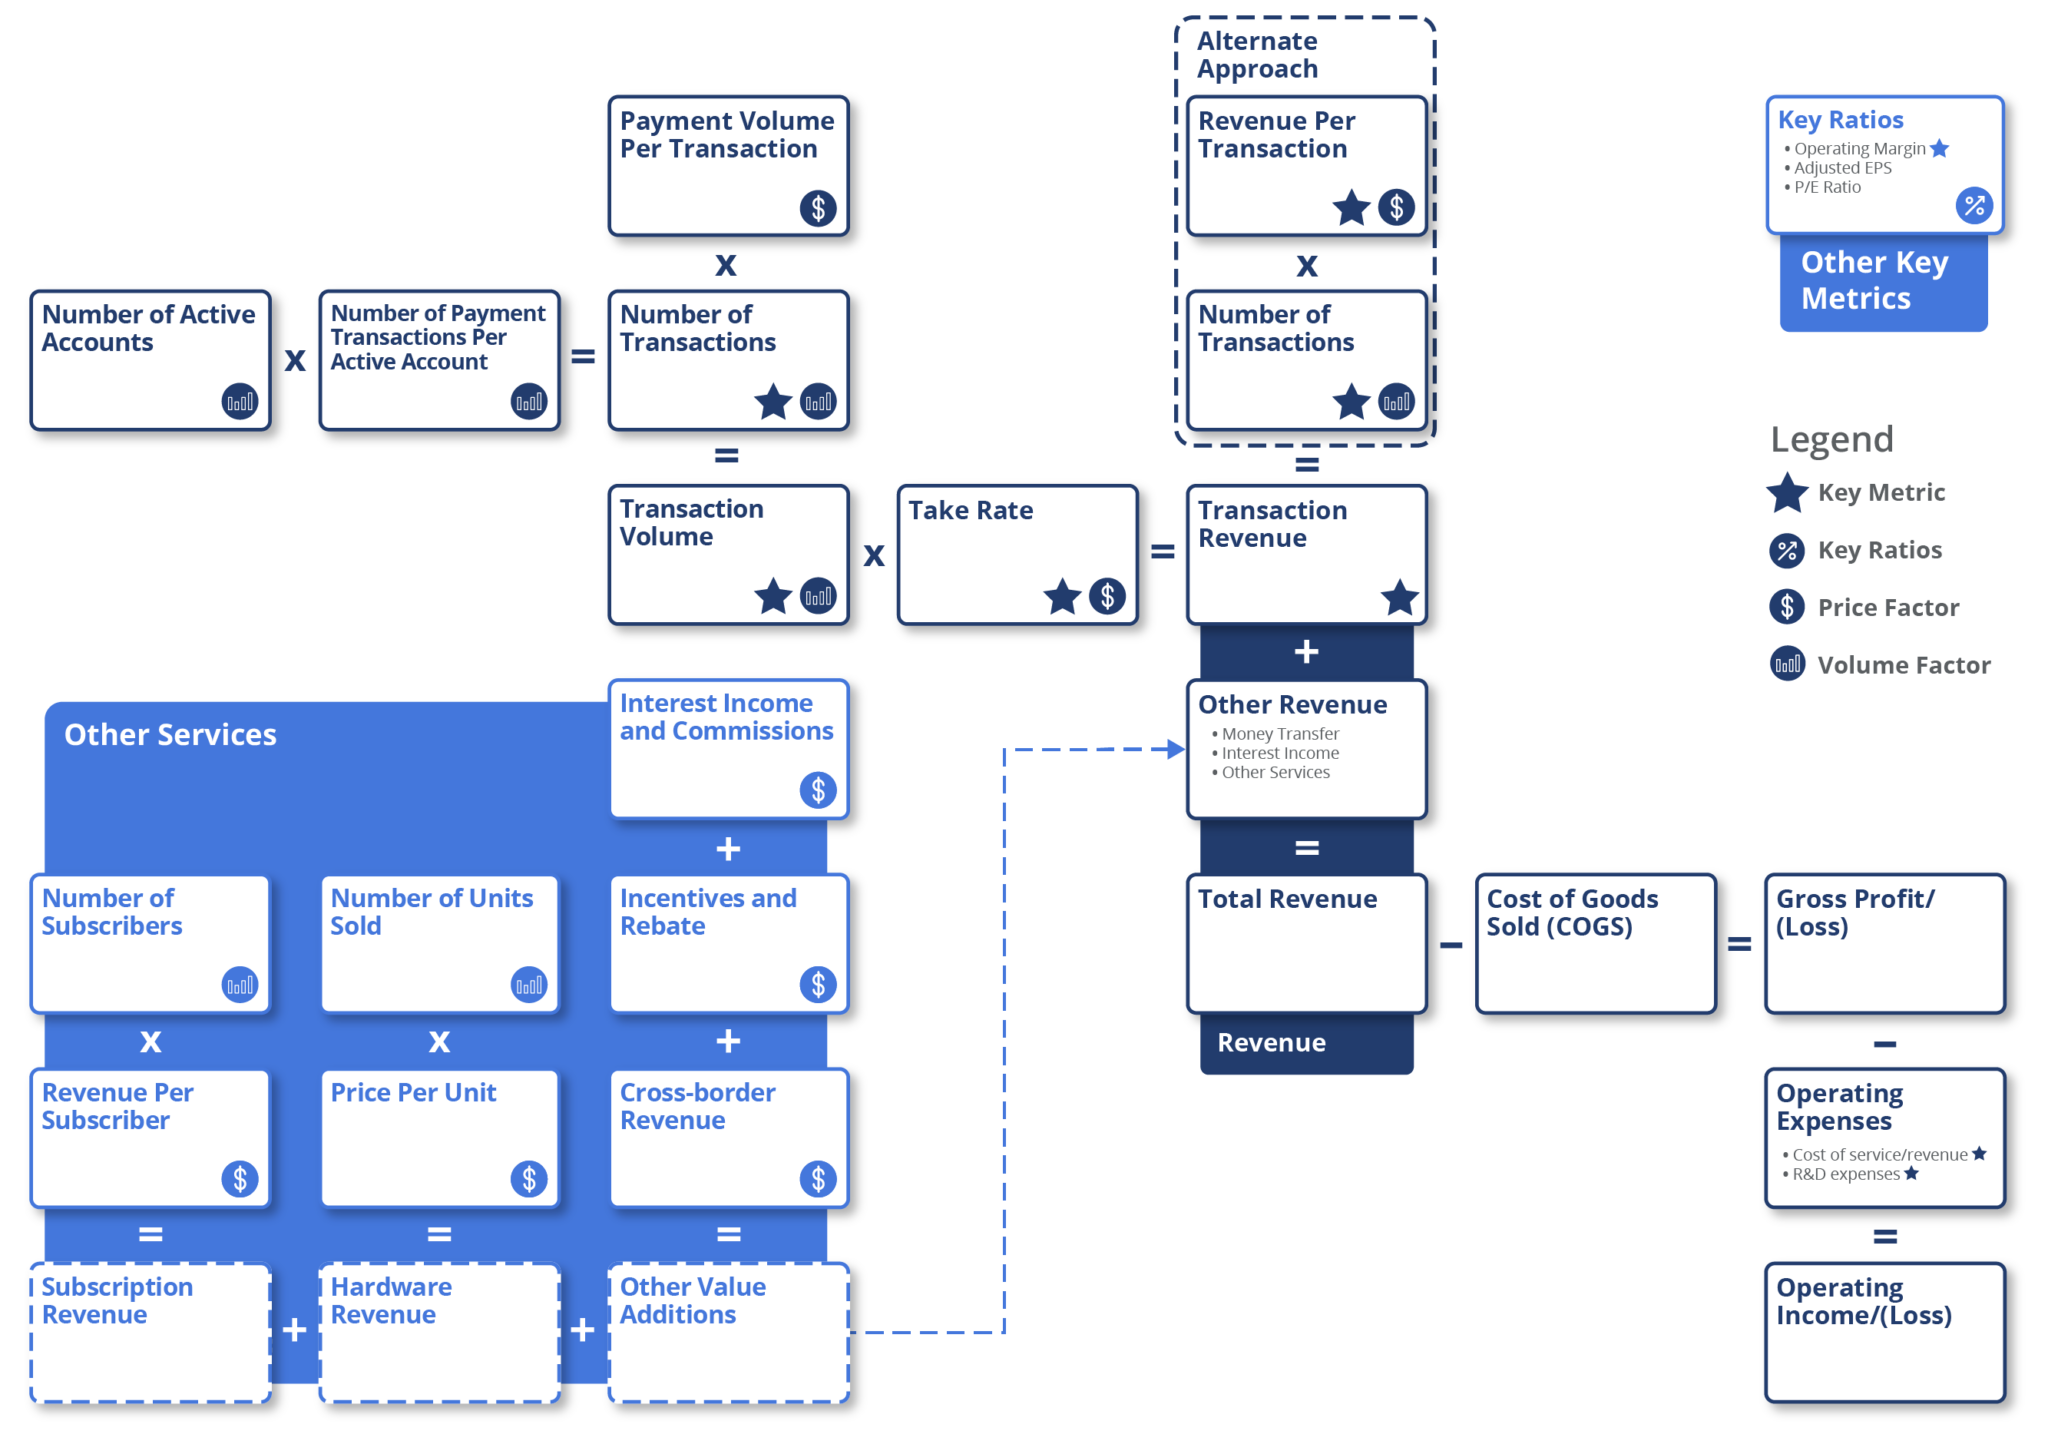
The business model of payment processing companies typically involves charging merchants or sellers a fee for every processed transaction. Transaction revenue is a key source of revenue for payment processing companies and is directly tied to the volume and value of transactions processed. Transaction revenue is the revenue generated by payment processing companies for facilitating electronic transactions between buyers and merchants/sellers. This revenue is usually a percentage of the transaction value and is earned by the payment processor for providing the infrastructure, technology, and security required to process electronic payments.
Transaction revenue is calculated as transaction volume (also known as total payment volume) multiplied by the take rate. Take rate is the percentage of the transaction value that the payment processing company charges as a fee for its services. Total payment volume refers to the total amount of payments processed by the payment processing company.
Transaction volume is calculated as total payment transactions or the number of transactions multiplied by payment volume per transaction. Here, payment volume per transaction is the average value of each payment transaction processed by a payment processing company, and the number of transactions is the total number of payment transactions processed over a given period.
The number of transactions is calculated as the number of active accounts multiplied by the number of payment transactions per account. Here, the number of active accounts refers to the total number of active accounts (i.e., merchant accounts) that are using a payment processing company’s platform to accept payments. At the same time, the number of payment transactions per account represents the average number of payment transactions processed per active account over a given period.
Other revenue is revenue earned by payment processing companies from offering additional services or features beyond their core payment processing functionality that provide added value to merchants. Other revenue generated by payment processing companies can be calculated as a sum of subscription revenue, hardware revenue, foreign exchange revenue, and other value additions.
Payment processing companies earn subscription revenue by providing merchants with subscription-based services that may include premium features like enhanced fraud protection, analytical tools, payment gateway services, and subscription-based POS systems. Hardware revenue is generated by payment processing companies through the sale of various hardware products and solutions to merchants, such as card readers, POS systems, and integrated payment solutions.
Additionally, payment processing companies generate revenue from other value-added services such as interest earned on merchant deposits, commissions earned on payment processing services, incentives or rebates offered to merchants for using their platform or meeting certain transaction volume requirements, and revenue generated from processing cross-border payments, which are payments made between buyers and sellers in different countries.
Most companies in the payment processing industry report revenue on a gross basis, except for Block (NYSE: SQ), where transaction expenses are netted against operating revenue.
To evaluate the profitability of companies in this industry, analysts focus on operating margins, gross margins, net margins, and adjusted EPS.
- Gross margin refers to the percentage difference between the total revenue generated from payment processing services and the direct costs associated with providing those services. It is a key financial metric that reflects the profitability of a payment processing company’s core operations.
Gross margin is calculated as:
Gross Margin=(Total Revenue−COGS)/ Total Revenue × 100%Here, COGS (cost of goods sold) includes expenses such as interchange fees, processing fees, and other costs directly associated with facilitating payment transactions.
- Net margin is a key financial metric that measures the profitability of a company’s overall operations after accounting for all expenses, including operating costs, interest, taxes, and other non-operational items. It provides a percentage representation of how much profit a payment processing company retains from its total revenue.
Net margin is calculated as:
Net Margin=(Net Income / Total Revenue) × 100% - Operating margin is a measure of the company’s operating income as a percentage of its revenue. After deducting its operating expenses, it shows how much profit a company generates from its operations. A higher operating margin indicates better efficiency in managing costs.
Operating margin is calculated as:
Operating Margin=(Operating Income / Total Revenue) × 100%
Available Comp Tables - Consensus Estimates
Visible Alpha offers seven payment processing-related comp tables, comparing forecasts for key financial and operating metrics, to make it easy to quickly conduct relative analysis, whether you are interested in looking at key values for global companies, Americas, or Europe. Every pre-built, customizable comp table is based on region, sub-industry, or key operating metrics.

Global Financial and Operating KPIs Company Examples:
North America
- PayPal Holdings, Inc. (NASDAQ: PYPL)
- MASTERCARD INC (NYSE: MA)
- Fiserv, Inc. (NYSE: FI)
- VISA INC. (NYSE: V)
EMEA
- Adyen N.V. (AEX: ADYEN)
- Worldline SA (EPA: WLN)
- Wise Plc (LSE: WISE)
APAC
- GMO Payment Gateway Inc. (TSE: 3769)
- kakaopay Corp. (KRX: 377300)
- Zip Co Limited (ASX: ZIP)
Download Report
This guide highlights the key performance indicators for the payment processing industry and where investors should look to find an investment edge, including:
- Payment Processing Industry Business Model & Diagram
- Key Payment Processing Industry Metrics PLUS Visible Alpha’s Standardized Industry Metrics
- Available Comp Tables
- Industry KPI Terms & Definitions