
Guide to Movies and Entertainment KPIs
This guide highlights the key performance indicators for the movies and entertainment industry and where investors should look to find an investment edge.
Industry Overview
The movies and entertainment industry is part of the larger media sector. In this guide, we focus not only on the movies and entertainment industry as a whole but also dive into a number of key sub-industries that include:
-
Broadcasting
-
Cable Networks
-
Streaming & OTT Services
-
Studio Entertainment
-
Theaters
-
Music
The broadcasting industry comprises broadcasters that use public airwaves to transmit programs available to any television set within the range of a broadcast transmitter, at no cost to the viewer. The services rendered by companies in the industry are also known as free-to-air services. Before the arrival of cable TV, the television landscape in the United States was dominated by broadcasters. Companies in the industry include ABC (The Walt Disney Company), CBS (Paramount Global), and Fox (Fox Corporation).
The arrival of cable TV was a major disruption for the broadcasting industry. The cable network industry comprises traditional multichannel video programming distributors (MVPD) that transmit live television programs to viewers via satellite and cable infrastructure on a subscription basis. Unlike broadcast channels, cable networks do not use public airwaves. Instead, they charge viewers subscription fees for transmission. Companies in the industry include HBO (Warner Bros. Discovery), Fox News (Fox Corporation), and Nickelodeon (Paramount Global).
Streaming services allow viewers to watch content on demand. Also known as OTT, which stands for “Over-the-Top,” it refers to any streaming service that delivers content over the internet. Companies in this industry are online providers of entertainment including movies, TV shows, music, live events, and news, among others. Subscribers of streaming service providers can view the content on their smart televisions, computers, tablets, and/or smartphones. Companies in this space include Netflix, Disney+, Hulu, Amazon Prime Video, and HBO, among others. Services offered by streaming and OTT platforms include:
- Subscription video on demand (SVOD)
- Transactional video on demand (TVOD)
- Advertising video on demand (AVOD)
These services are explained in detail in the business model section of the guide. Streaming music providers are covered separately below.
The studio entertainment industry comprises motion picture studios and entertainment companies that facilitate the production of movies. These companies produce and distribute full-length movies, short films, and animated films, among others. Companies in the studio entertainment industry include Walt Disney Pictures (Disney), Universal Studios (Comcast), Fox Studio (Fox Corporation), and Lionsgate.
The theater or cinema industry comprises companies that primarily show movies produced by the studio entertainment industry in movie theaters. It includes cinemas, drive-ins, and outdoor movie theaters. Companies in the industry include AMC Entertainment, Cinemark Holdings, and Cineworld Group.
The music industry consists of companies involved in the production and/or distribution/streaming of music. Music production companies produce, sell, and license musical recordings; and may also own and license musical copyrights. Major companies include Universal Music, Warner Music, and Sony Music.
Music distribution companies are providers of music streaming services and include companies such as Amazon Music, Apple Music, and Spotify.
Companies in the movies and entertainment industry are involved in the creation, marketing, and distribution of audiovisual pieces including television programs, commercials, content streaming, motion pictures, music, video and audio recording services, radio, gaming, and ancillary services and products.

Key Movies and Entertainment Metrics
Key performance indicators (KPIs) are the most important business metrics for a particular industry. To gauge market expectations for the movies and entertainment industry, whether at a company or industry level, some industry KPIs to consider are:
Overall Movies and Entertainment
- Net Debt / EBITDA
- Capex / Sales
- Free Cash Flow (FCF)
- Net Margin
- EBITDA Margin
- Operating Margin
Streaming and OTT Services
- Gross Addition
- Disconnects
- Churn Rate
- Ending Subscribers
- Average Revenue Per User
Theater
- Attendance Per Average Screen
- Average Concession Per Patron
Movies and Entertainment Business Model
-
Expenses
-
Revenue
-
Profitability
Cable Networks
Some major expenses for the cable network industry are:
- Programming costs
- Retransmission costs
- Labor and overhead costs
Streaming and OTT Services
Some major expenses for the streaming and OTT service industry include:
- Cost of sales – Amortization of content assets accounts for a majority of the cost of sales
- Expenses directly associated with the acquisition, licensing, and production of content including payroll, copyrights, and miscellaneous production-related costs, among others
- Marketing expenses
- Technology and development expenses
- General administrative expenses
- Depreciation & amortization (D&A) expenses
- Other operating expenses
Studio Entertainment
A major expense for studio entertainment companies is production costs. Production costs include crew wages, production design, live set and studio costs, costumes, catering, travel, and accommodation. Apart from production costs, equally important are advertising and marketing expenses before and during theatrical releases.
Theater
Some major expenses for the theater industry are:
- Film exhibition costs
- Food and beverage costs
- Rental expenses (lease)
- General and administrative expenses, including salaries and wages
- D&A expenses
- Other operating expenses
Music
Some major expenses for the music industry are:
Music Publishing
- Artist costs
- Licensing and content costs
- Salaries and other expenses
- Product costs
- Marketing and promotional expenses
Music Streaming
- Salaries and other expenses
- Product costs
- Marketing and promotional expenses
Broadcasting
Broadcasting companies primarily drive their revenue from TV advertising. The advertising model is based on viewer ratings and the time of day.
Cable Networks
Cable network providers generate a majority of their revenue from affiliate fees and advertising sales. Affiliate fees are carriage fees paid by multichannel video programming distributors (MVPDs) per month per subscriber. MVPDs provide multiple broadcast TV channels on cable or satellite TV and generally work on a subscription-based business model, but they can also offer video-on-demand options. The amount a cable network provider charges the MVPD largely depends on the quality and quantity of content provided.
Cable networks also sell advertisers’ slots in between TV programs. The ability to sell advertising time and the rates that can be charged primarily depend on the size and the nature of the audience that the cable network can deliver to the advertiser.
Streaming and OTT Services
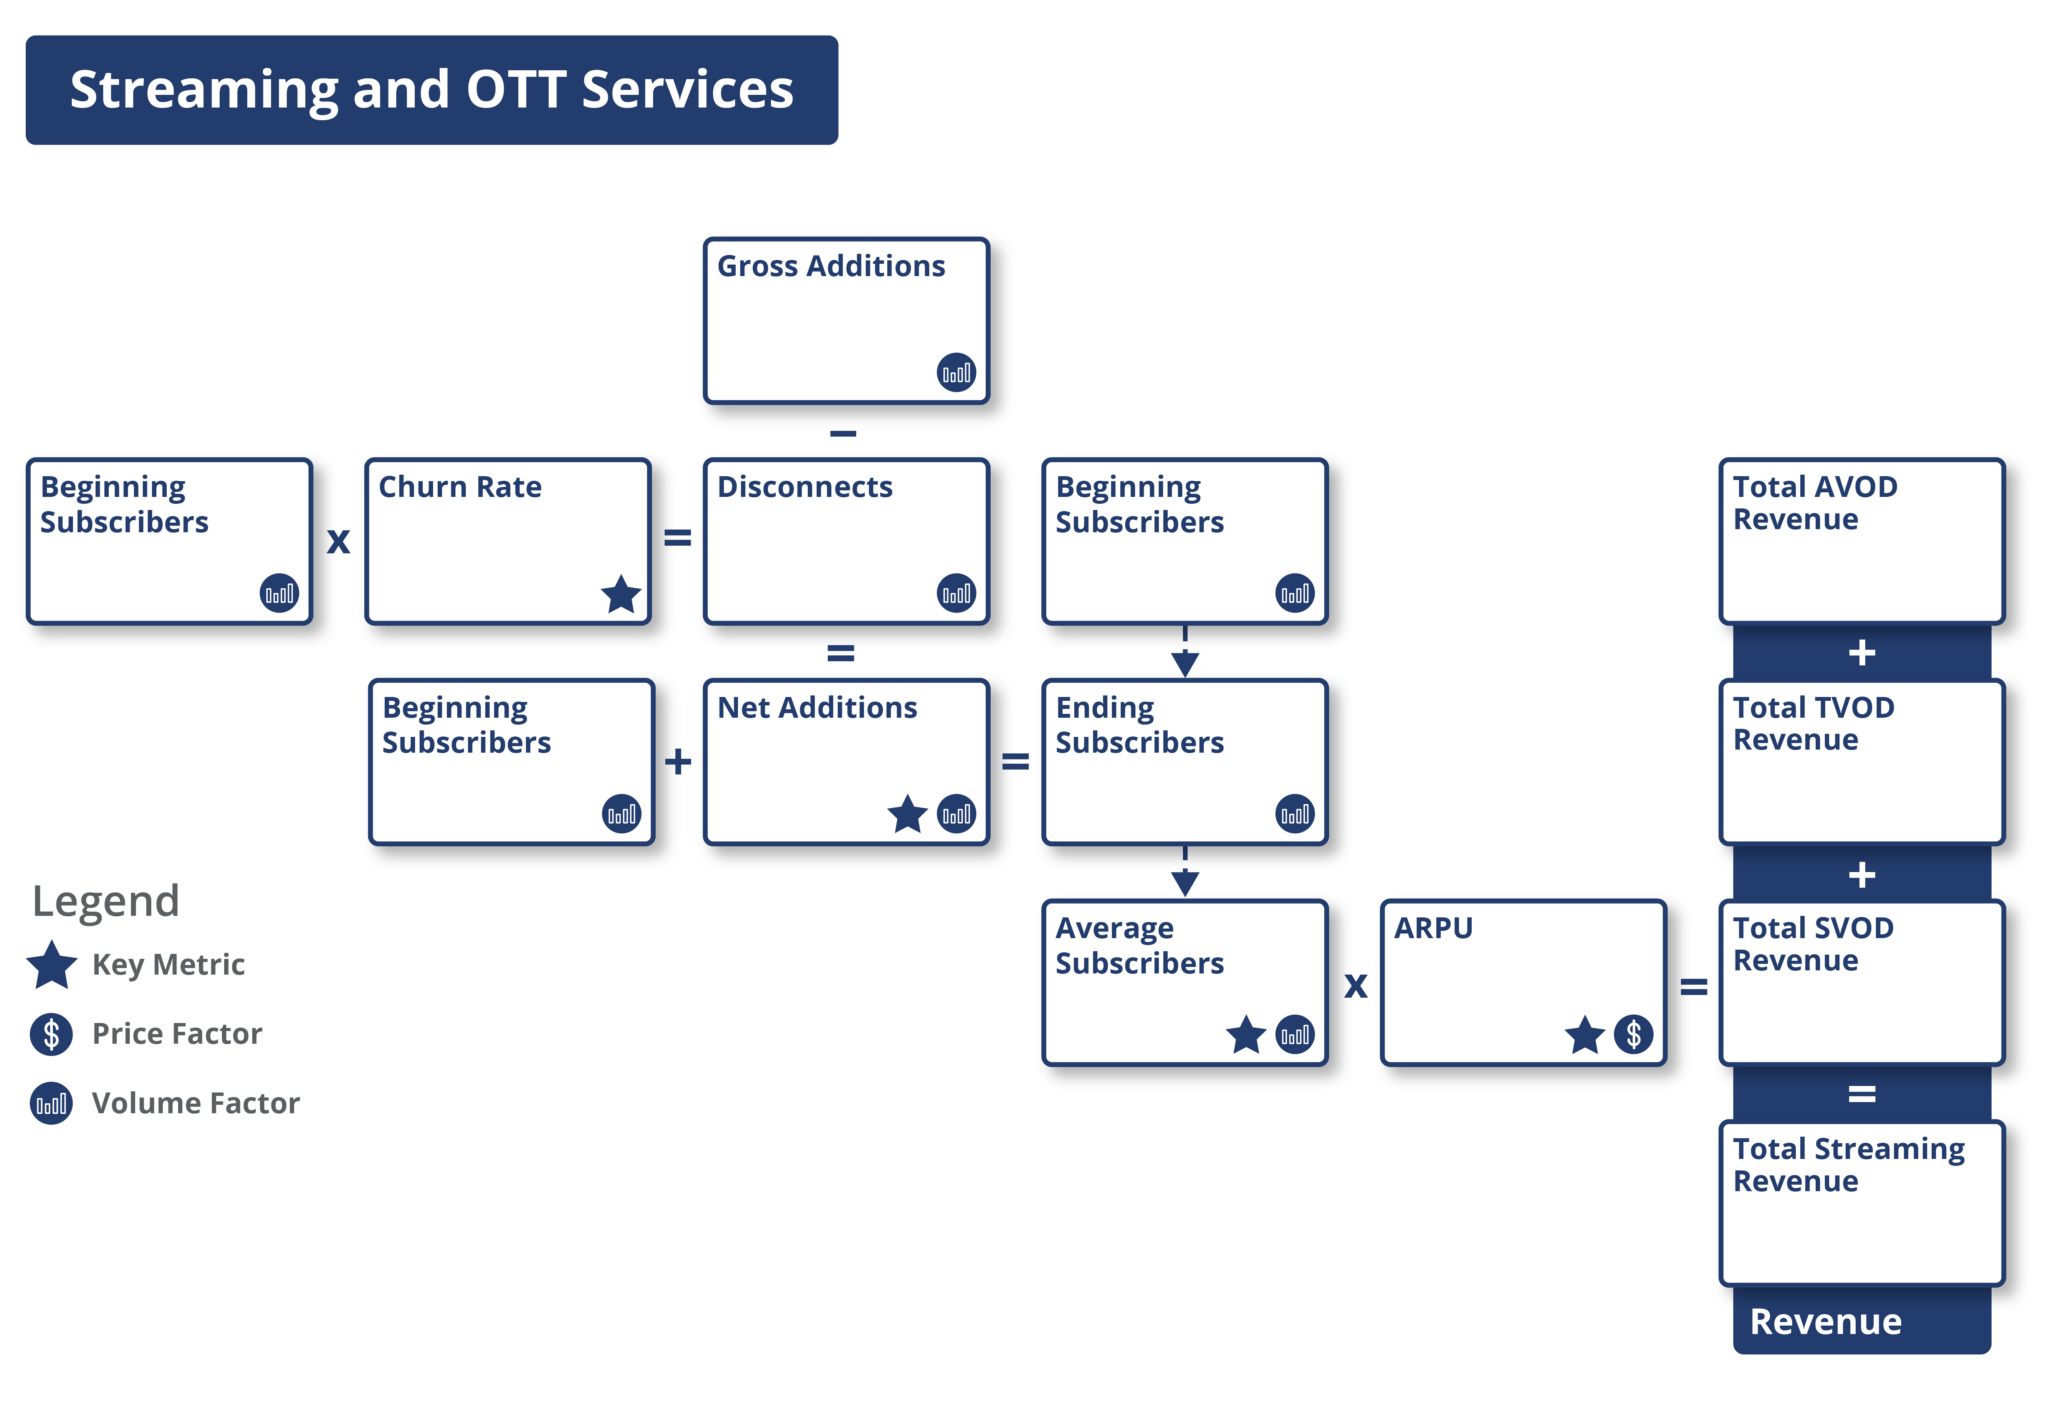
The streaming and OTT services industry generates revenue from streaming content such as movies and TV shows to viewers. This content can either be self-produced or purchased as streaming rights from filmmakers. Companies in the industry generate revenue from their subscribers. OTT players follow one of the three models to generate revenue – SVOD, TVOD, and AVOD.
SVOD stands for subscription video on demand and helps OTT players generate revenue from subscription fees paid by subscribers to view content on their platform. This model is adopted by players such as Netflix and Amazon Prime Video, among others. TVOD stands for transactional video on demand and helps OTT players generate revenue from subscribers who purchase content on a pay-per-view basis. This model is the opposite of SVOD, where subscribers can choose content based on their needs. Key players in this space include Apple’s iTunes, and Amazon Prime Video Store, among others. AVOD stands for advertising video on demand and helps OTT players generate revenue by posting ads on their platforms. Here, companies allow users to view the content for free but with intermittent advertisements. In this ad-based revenue model, AVOD service providers charge a fee to advertisers to place commercials between their content. Examples of this include YouTube and Hulu.
Studio Entertainment
Studio entertainment companies generate revenue by selling licenses and broadcasting rights to different end markets. These include:
- Theatrical Market
- Home Entertainment
- Television Market
- Others, including music groups and live events
The theatrical market comprises companies that produce and distribute short and full-length live-action or animated movies. Companies in the industry generate revenue from distribution rights and a certain percentage of the total revenue that is earned by the theaters after the release of the film.
The home entertainment market comprises studio entertainment companies that release movies under their own motion picture banner or through an independent distribution company and distribute their releases via Blu-ray discs, DVDs, and electronic formats to end consumers for at-home consumption. The source of revenue is the sale of DVDs or Blu-ray discs and licensing titles to video-on-demand (VOD) services for electronic delivery to consumers for a specified rental period. Home entertainment distribution usually starts three to six weeks after a movie’s theatrical release in the U.S. and differs from country to country.
The television market comprises cable and broadcasting networks, television stations, and other video service providers that buy movie licenses from studio entertainment companies. These companies provide content to their viewers on television or through internet-based devices. Here, the studio entertainment company generates revenue through licenses and broadcasting rights.
Theater
The cinema or theater industry generates revenue from the money spent by movie-goers in movie theaters and advertising at the theaters including the on-screen advertisements before the movies. Revenue from food and beverage sales (typically called concessions) is also an important contributor to revenue. Some examples of theaters are AMC Networks, Cinemark Holdings, and PVR Ltd.
For the theater industry, total revenue is the sum of admissions or movie ticket revenue, food & beverage revenue, and other theater revenue. Admission revenue is the largest source of revenue for a theater company. It is calculated as the average number of admissions or the number of tickets sold in a given period multiplied by the average ticket price. Admission revenue also depends on the number of screens in a theater. The more screens in a theater, the higher the ability to generate more admission revenue.
Food & beverage sales are the second largest source of revenue after admissions. Theaters use strategic placement of food and beverage items in theaters to reduce wait time, increase visibility and improve traffic flow. Food & beverage revenue is calculated as attendance multiplied by concession sales per patron sold in a theater.
Other theater revenue includes revenue earned from on-screen advertisements before the movies, ads inside the movie theater, income earned from gift cards and package ticket sales, private theater rentals, and more.
Music
Within the music industry, music producers or publishers mainly focus on selling, marketing, promoting, and licensing recordings of musical compositions. A major revenue source for production companies is recording and publishing music. Recorded music revenue is the sum of digital, physical, and licensing music revenue.
For music streaming companies like Apple Music and Spotify, a key metric reported is monthly active users (MAUs). MAU is used by analysts to identify the number of unique users on a company’s platform. Another key metric for music streaming companies is average revenue per user (ARPU). ARPU is the revenue generated per unit or user by a company. ARPU is calculated as total revenue divided by the number of subscribers or users. ARPU is a unit pricing factor and is measured monthly, quarterly, or annually.
Investors in the movies and entertainment industry evaluate the profitability of companies by looking at EBITDA margin (%), operating margin (%), and net margin (%).
- EBITDA margin: EBITDA (earnings before interest, tax, depreciation, and amortization) margin measures a company’s operating profit (before depreciation) as a percentage of revenue
- Operating margin: Operating margin is a profitability ratio that measures the revenue of a company after covering all operating and non-operating expenses
- Net margin: Net margin measures how much net income or profit a company generates as a percentage of revenue
Some other key metrics and ratios that investors look at include:
- Capex to sales: Capex to sales ratio compares a company’s total sales to its investments in property, plant, equipment, and other capital assets. The ratio demonstrates how aggressively a company reinvests its revenue into productive assets
- Debt to EBITDA: The debt-to-EBITDA ratio compares a company’s overall commitments, including debt and other liabilities, to the real cash it generates and exposes whether or not the company is capable of paying its debt and other liabilities. When investors look at a company’s debt-to-EBITDA ratio, they try to figure out how well it can pay off its loans
- Free Cash Flow (FCF): Free cash flow is the cash a company generates after considering cash outflows or operating expenses and capital expenditures
Finally, to evaluate valuation, analysts rely on EV/EBITDA, price/earnings (P/E), price/sales (P/S), and price/book value (P/B) multiples for relative value comparisons.
Available Comp Tables - Consensus Estimates
Visible Alpha offers 12 movies and entertainment industry-related comp tables, comparing forecasts for key financial and operating metrics, to make it easy to quickly conduct relative analysis, whether you are interested in looking at key values for global companies, Americas, or Europe. Every pre-built, customizable comp table is based on region, sub-industry, or key operating metrics.

Global Financial and Operating KPIs Company Examples:
Brodcasting
- Nexstar Media Group, Inc. (NXST_US)
- HT&E Ltd (HT1_AU)
- Sinclair Broadcast Group, Inc. (SBGI_US)
- TEGNA INC (TGNA_US)
- Gray Television, Inc. (GTN_US)
Streaming and Over-the-Top (OTT) Services
- NETFLIX, INC. (NFLX)
- The Walt Disney Company (DIS)
- AMAZON.COM, INC. (AMZN)
- Comcast Corporation (CMCSA)
- Paramount Global (PARA_US)
Theater
- AMC Networks Inc (AMCX)
- Cineworld Group (CINE_UK)
- CINEMARK HOLDINGS INC (CNK_US)
- PVR Limited (PVR_IN)
- Inox Leisure Ltd (INOL_IN)
Cable Network
- Comcast Corporation (CMCSA)
- Fox Corporation (FOX)
- AMC Networks Inc (AMCX)
- Lions Gate Entertainment Corp. (LGF_US)
- Vivendi SA (VIV_FR)
Download Report
This guide highlights the key performance indicators for movies and entertainment and where investors should look to find an investment edge, including:
- Movies and Entertainment Business Model & Diagram
- Key Movies and Entertainment Metrics PLUS Visible Alpha’s Standardized Industry Metrics
- Available Comp Tables
- Industry KPI Terms & Definitions