


Guide to Delivery, Airfreight & Logistics Industry KPIs
This guide highlights the key performance indicators for the Delivery, Airfreight, and Logistics industry and where investors should look to find an investment edge.
Industry Overview
The delivery, airfreight, and logistics industry comprise companies that provide courier, packaging, mail delivery services, air freight transportation, ocean freight transportation, supply chain management, and logistics services. The services offered by companies in this industry include time-definite delivery, small package ground delivery, low-cost or economical delivery, and day-definite delivery for express letters, documents, small packages, and palletized freight. These companies provide domestic, international, commercial, as well as residential freight services via air, ocean, and land.
Trucking and railroads are some of the other prominent industries in the larger transportation and logistics space. You can learn more about the two industries by visiting Visible Alpha’s Guide to Railroads KPIs and Visible Alpha’s Guide to Trucking KPIs.
Key Delivery, Airfreight & Logistics Industry Metrics
Key performance indicators (KPIs) are the most important business metrics for a particular industry. When understanding market expectations for the Delivery, Airfreight, and Logistics industry, whether at a company or industry level, some industry KPIs to consider are:
- Volume (Parcel, Mail/Envelope, Ocean Freight, and Air Freight)
- Revenue Per Unit (Parcel, Mail/Envelope, Ocean Freight, and Air Freight)
- Employee Costs
- Purchased Transportation
- Fuel Expenses
- Depreciation and Amortization Expenses
- Maintenance and Repair Costs
- Total Operating Expenses
- Operating Income/(Loss)
- Operating Ratio
- EBITDA Margin
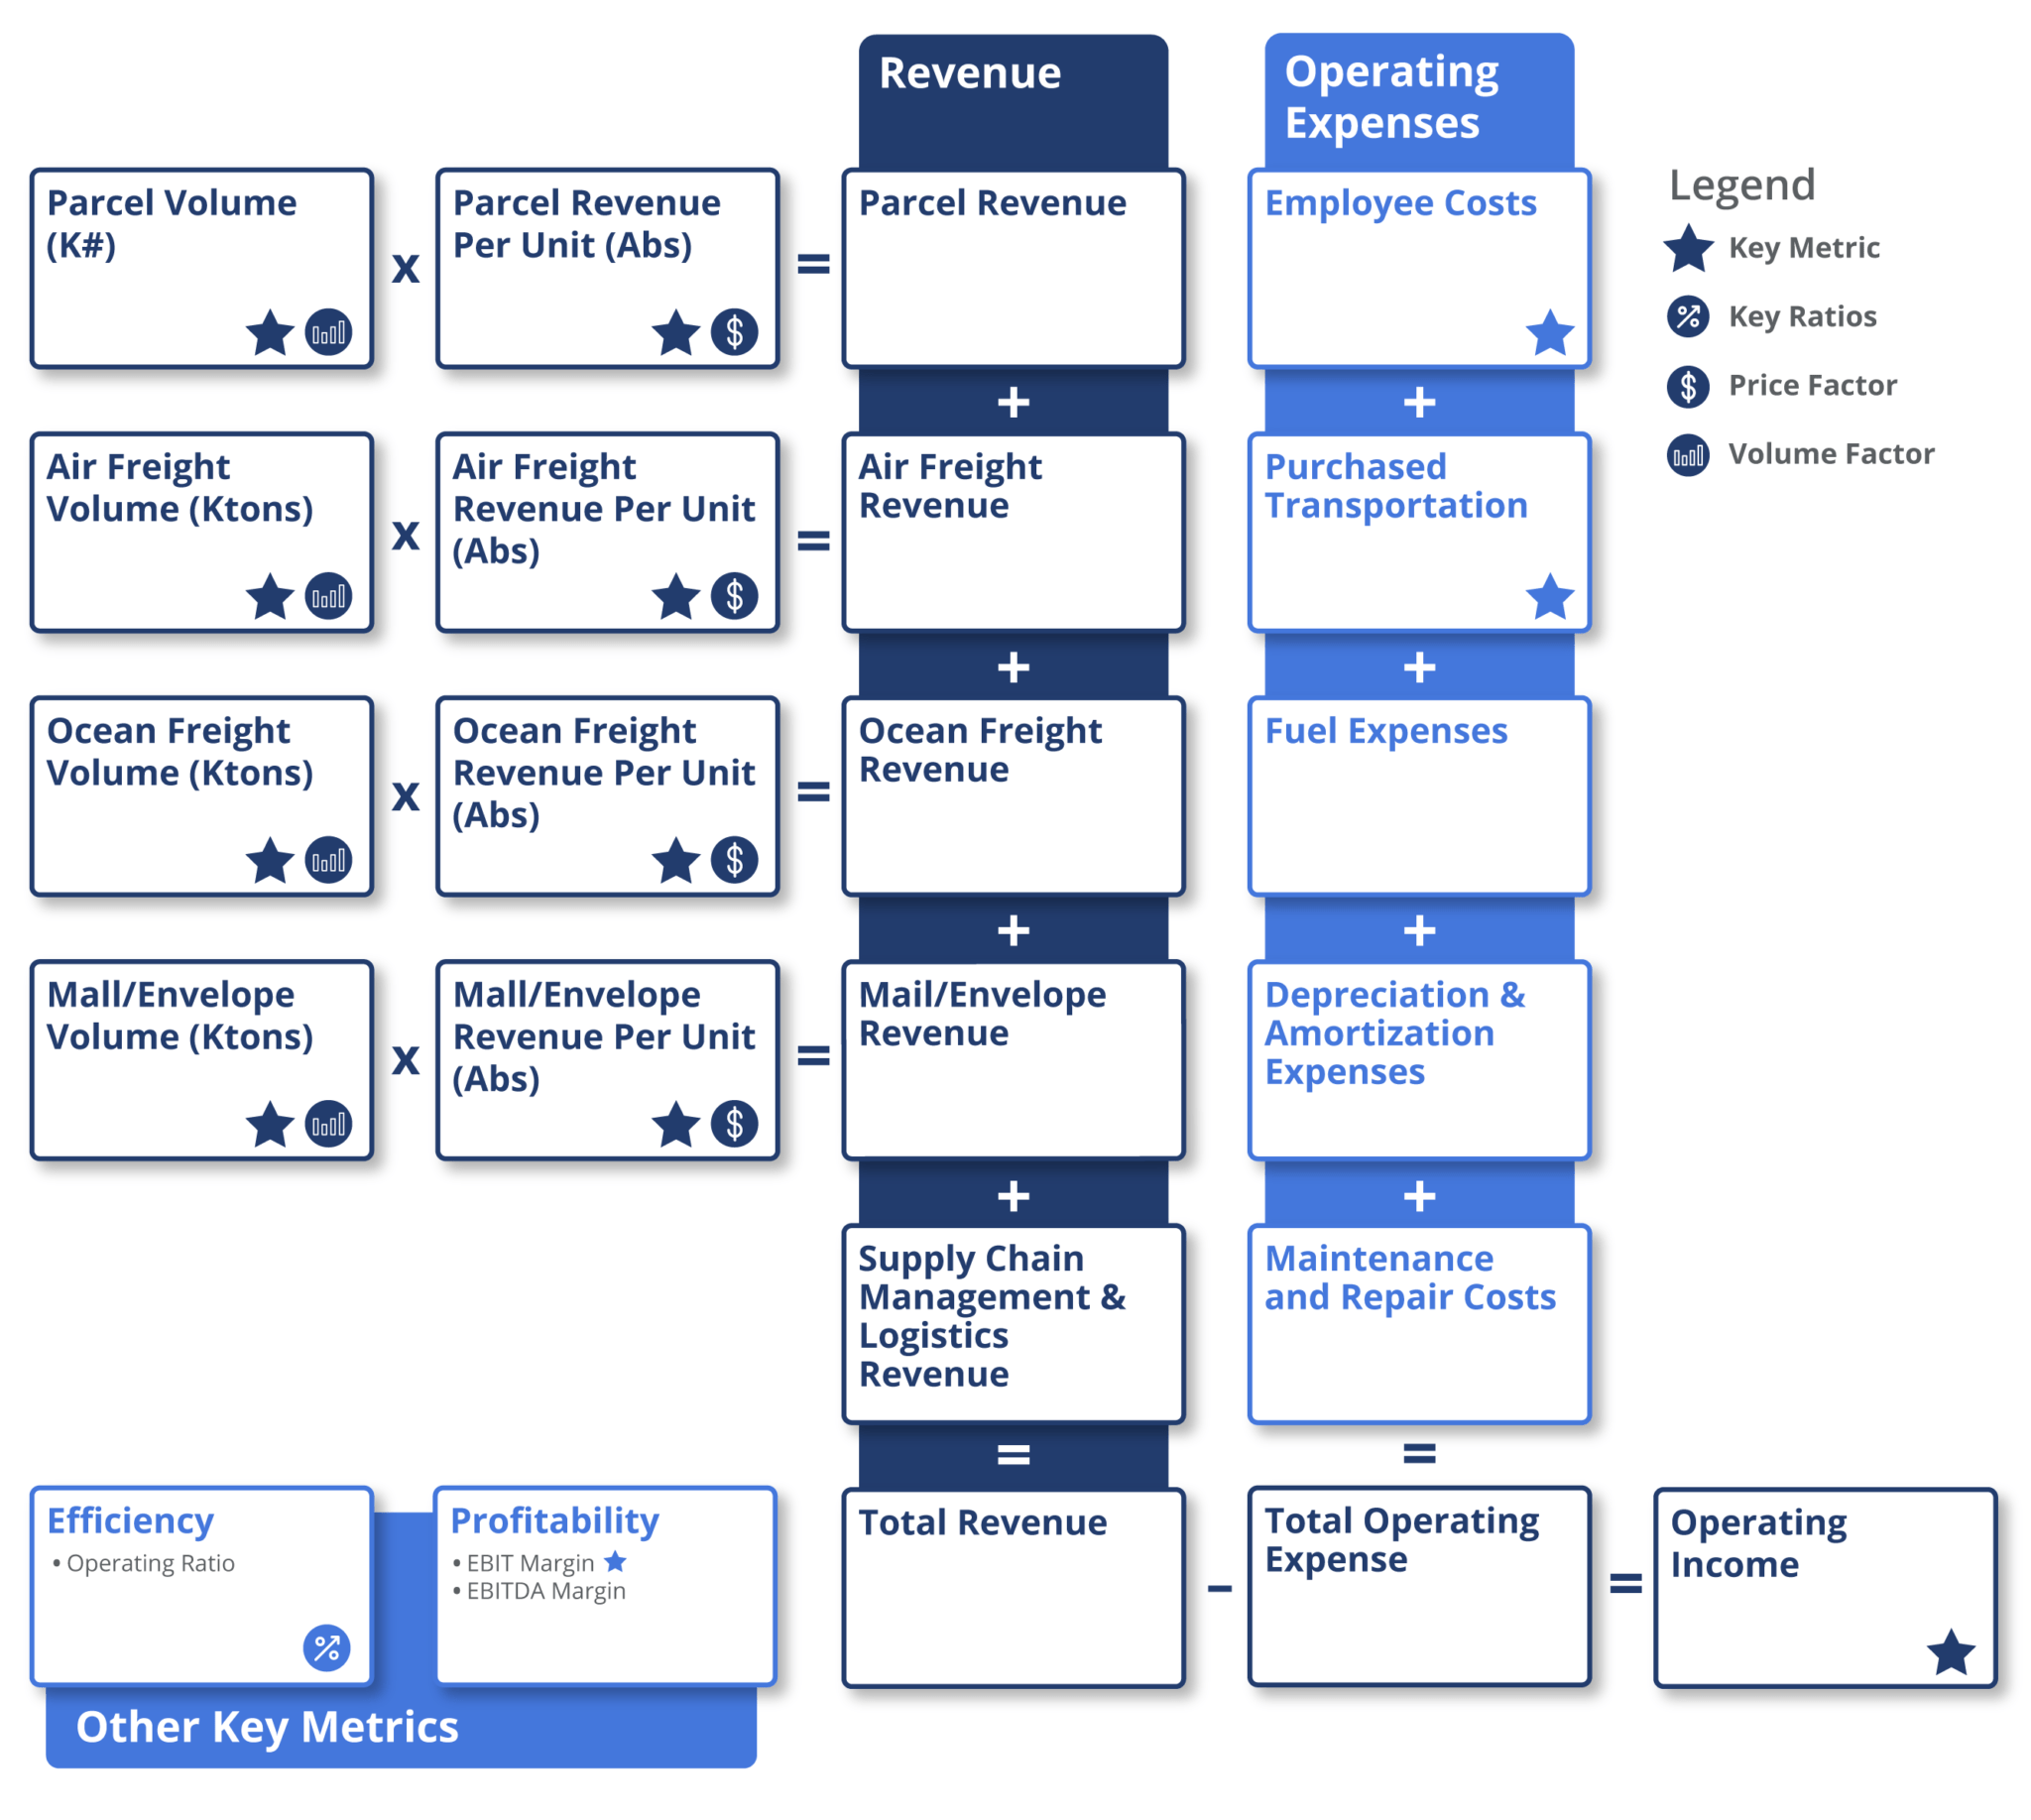
Delivery, Airfreight & Logistics Industry Business Model
-
Expenses
-
Revenue
-
Profitability
Some major expenses for delivery, airfreight, and logistics companies include:
- Employee costs
- Purchased transportation
- Fuel expenses
- Depreciation and amortization expenses
- Maintenance and repair costs
Together these expenses account for the total operating expenses of companies in the industry. A highly tracked efficiency ratio for expenses in this industry is the operating ratio, and it is calculated by dividing the total operating expense by the total revenue.
Companies in this industry generate revenue from providing packages, mail, and other delivery services. Total revenue is the sum of revenue generated from parcel delivery, mail/envelope delivery, air freight delivery, ocean freight delivery, logistics, and supply chain management services.
Parcel revenue is derived by multiplying volume – which is the number of parcels – with revenue per package delivered. Mail or envelope revenue is derived by multiplying volume – the number of mail/envelope – with revenue per mail delivered. Ocean freight revenue is derived by multiplying the volume delivered via ocean with revenue per parcel. Airfreight revenue is derived by multiplying the volume delivered via air with revenue per parcel.
In addition to traditional delivery services, companies provide logistics services that include transportation, storage/loading and unloading, international logistics, logistics equipment leasing, and packing services to customers. And lastly, supply chain management revenue is generated by providing customized supply chain solutions to customers including warehousing, brokerage services, transportation, and other value-added services.
Key measures of profitability for companies in the industry are EBIT (earnings before interest & taxes) margin and EBITDA (earnings before interest, taxes, depreciation & amortization) margin. EBIT margin, also known as operating margin and is calculated as EBIT divided by total revenue. EBITDA is an important metric for companies in the delivery, airfreight, and logistics industry, given the industry’s high depreciation and amortization costs. EBITDA margin is a measure of a company’s operating profit as a percentage of its total revenue. Investors evaluate profitability by looking at the level and directional change of EBITDA margin.
Available Comp Tables - Consensus Estimates
Visible Alpha offers 16 Delivery, Airfreight, and Logistics industry-related comp tables, comparing forecasts for key financial and operating metrics, to make it easy to quickly conduct relative analysis, whether you are interested in looking at key values for global companies, Americas, or Europe. Every pre-built, customizable comp table is based on region, sub-industry, or key operating metrics.
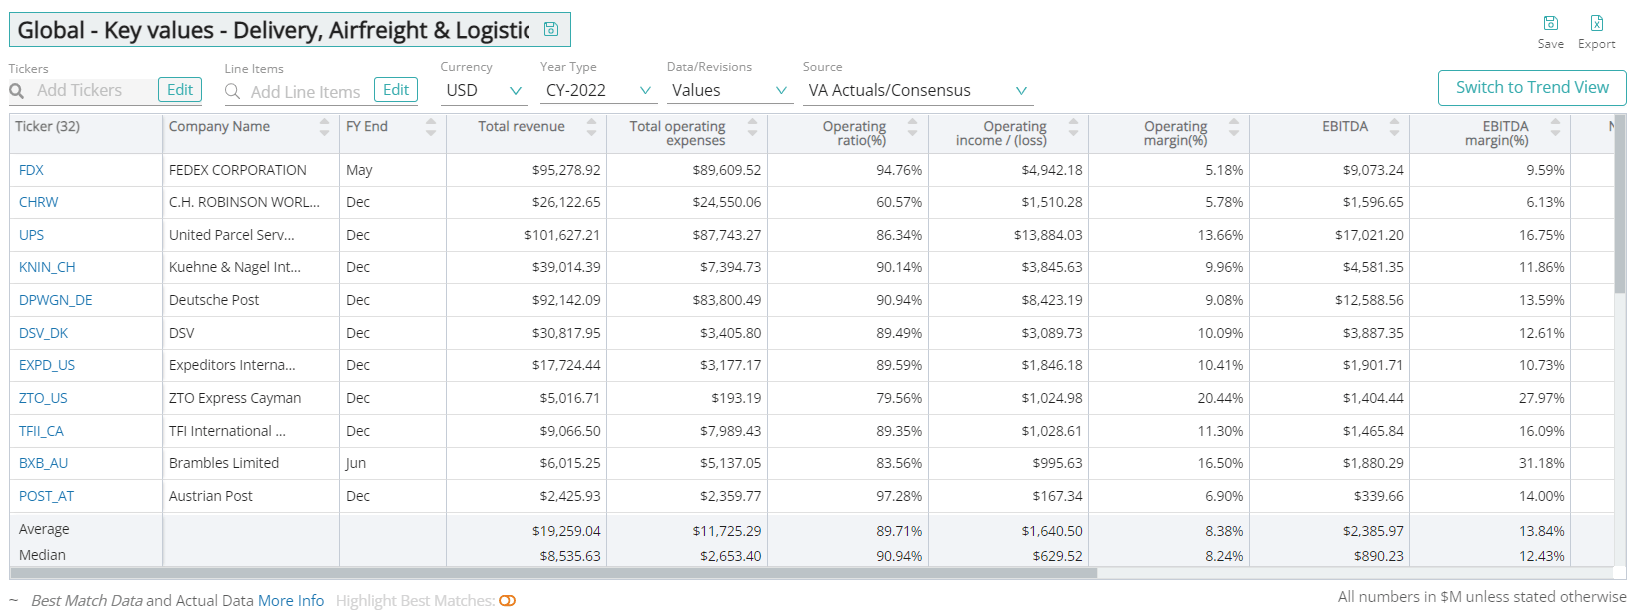
Global Financial and Operating KPIs Company Examples:
North America
- Fedex Corporation (FDX)
- United Parcel Service, Inc. (UPS)
- C.H. Robinson Worldwide Inc. (CHRW)
- Expeditors International of Washington Inc. (EXPD_US)
- Ryder Systems Inc. (R_US)
EMEA
- Deutsche Post (DPWGN_DE)
- Bollore SA (BOL_FR)
- Kuehne & Nagel International (KNIN_CH)
- DSV (DSV_DK)
- Royal Mail Plc (RMG_UK)
APAC
- S.F. Holding Co., Ltd. (002352_CN)
- Nippon Express Co., Ltd. (9062_JP)
- Yamato Holdings (9064_JP)
- Hyundai Glovis (086280_KR)
- CJ Logistics (000120_KR)
Download Report
This guide highlights the key performance indicators for the delivery, airfreight & logistics industry and where investors should look to find an investment edge, including:
- Delivery, Airfreight & Logistics Industry Business Model & Diagram
- Key Delivery, Airfreight & Logistics Industry Metrics PLUS Visible Alpha’s Standardized Industry Metrics
- Available Comp Tables
- Industry KPI Terms & Definitions