


Guide to Data Center Industry KPIs
This guide highlights the key performance indicators for the Data Center industry and where investors should look to find an investment edge.
Industry Overview
Digital advancements have made it crucial for businesses to invest in data centers to house critical computing infrastructure, servers, external power systems, networking and communication systems, cabling systems, and security systems, among others. Data centers are specialized facilities that house such computer systems and associated components.
Data centers can be of different types, depending on the needs of businesses. Some common types include:
- Enterprise data centers, owned and operated by companies in-house.
- Colocation data centers that rent individual servers, racks/cabinets, bandwidth, other equipment, and space to companies/tenants on lease.
- Managed data centers that not only offer servers or cabinets for rent but also provide management services including maintenance, system upgrades, and restoring services, among others.
- Cloud data centers that provide third-party cloud services to set up virtual data centers on the cloud. This concept is similar to colocation data centers but is off-premise and hosted by a cloud service provider.
Data center REITs, where REIT stands for real estate investment trust, own and manage data center facilities. They offer a range of products and services to help keep a company’s servers and data safe, including providing uninterruptible power supplies, air-cooled chillers, and physical security. The core services offered by data center REITs include network infrastructure, storage infrastructure, and computing resources.
Key Data Center Industry Metrics
Key performance indicators (KPIs) are the most important business metrics for a particular industry. When understanding market expectations for Data Centers, whether at a company or industry level, some Data Center KPIs to consider are:
Pure-play Data Center – By Storage Capacity
- Cabinet Capacity
- Utilization
- Billed Cabinets
- Average Monthly Revenue Per Cabinet
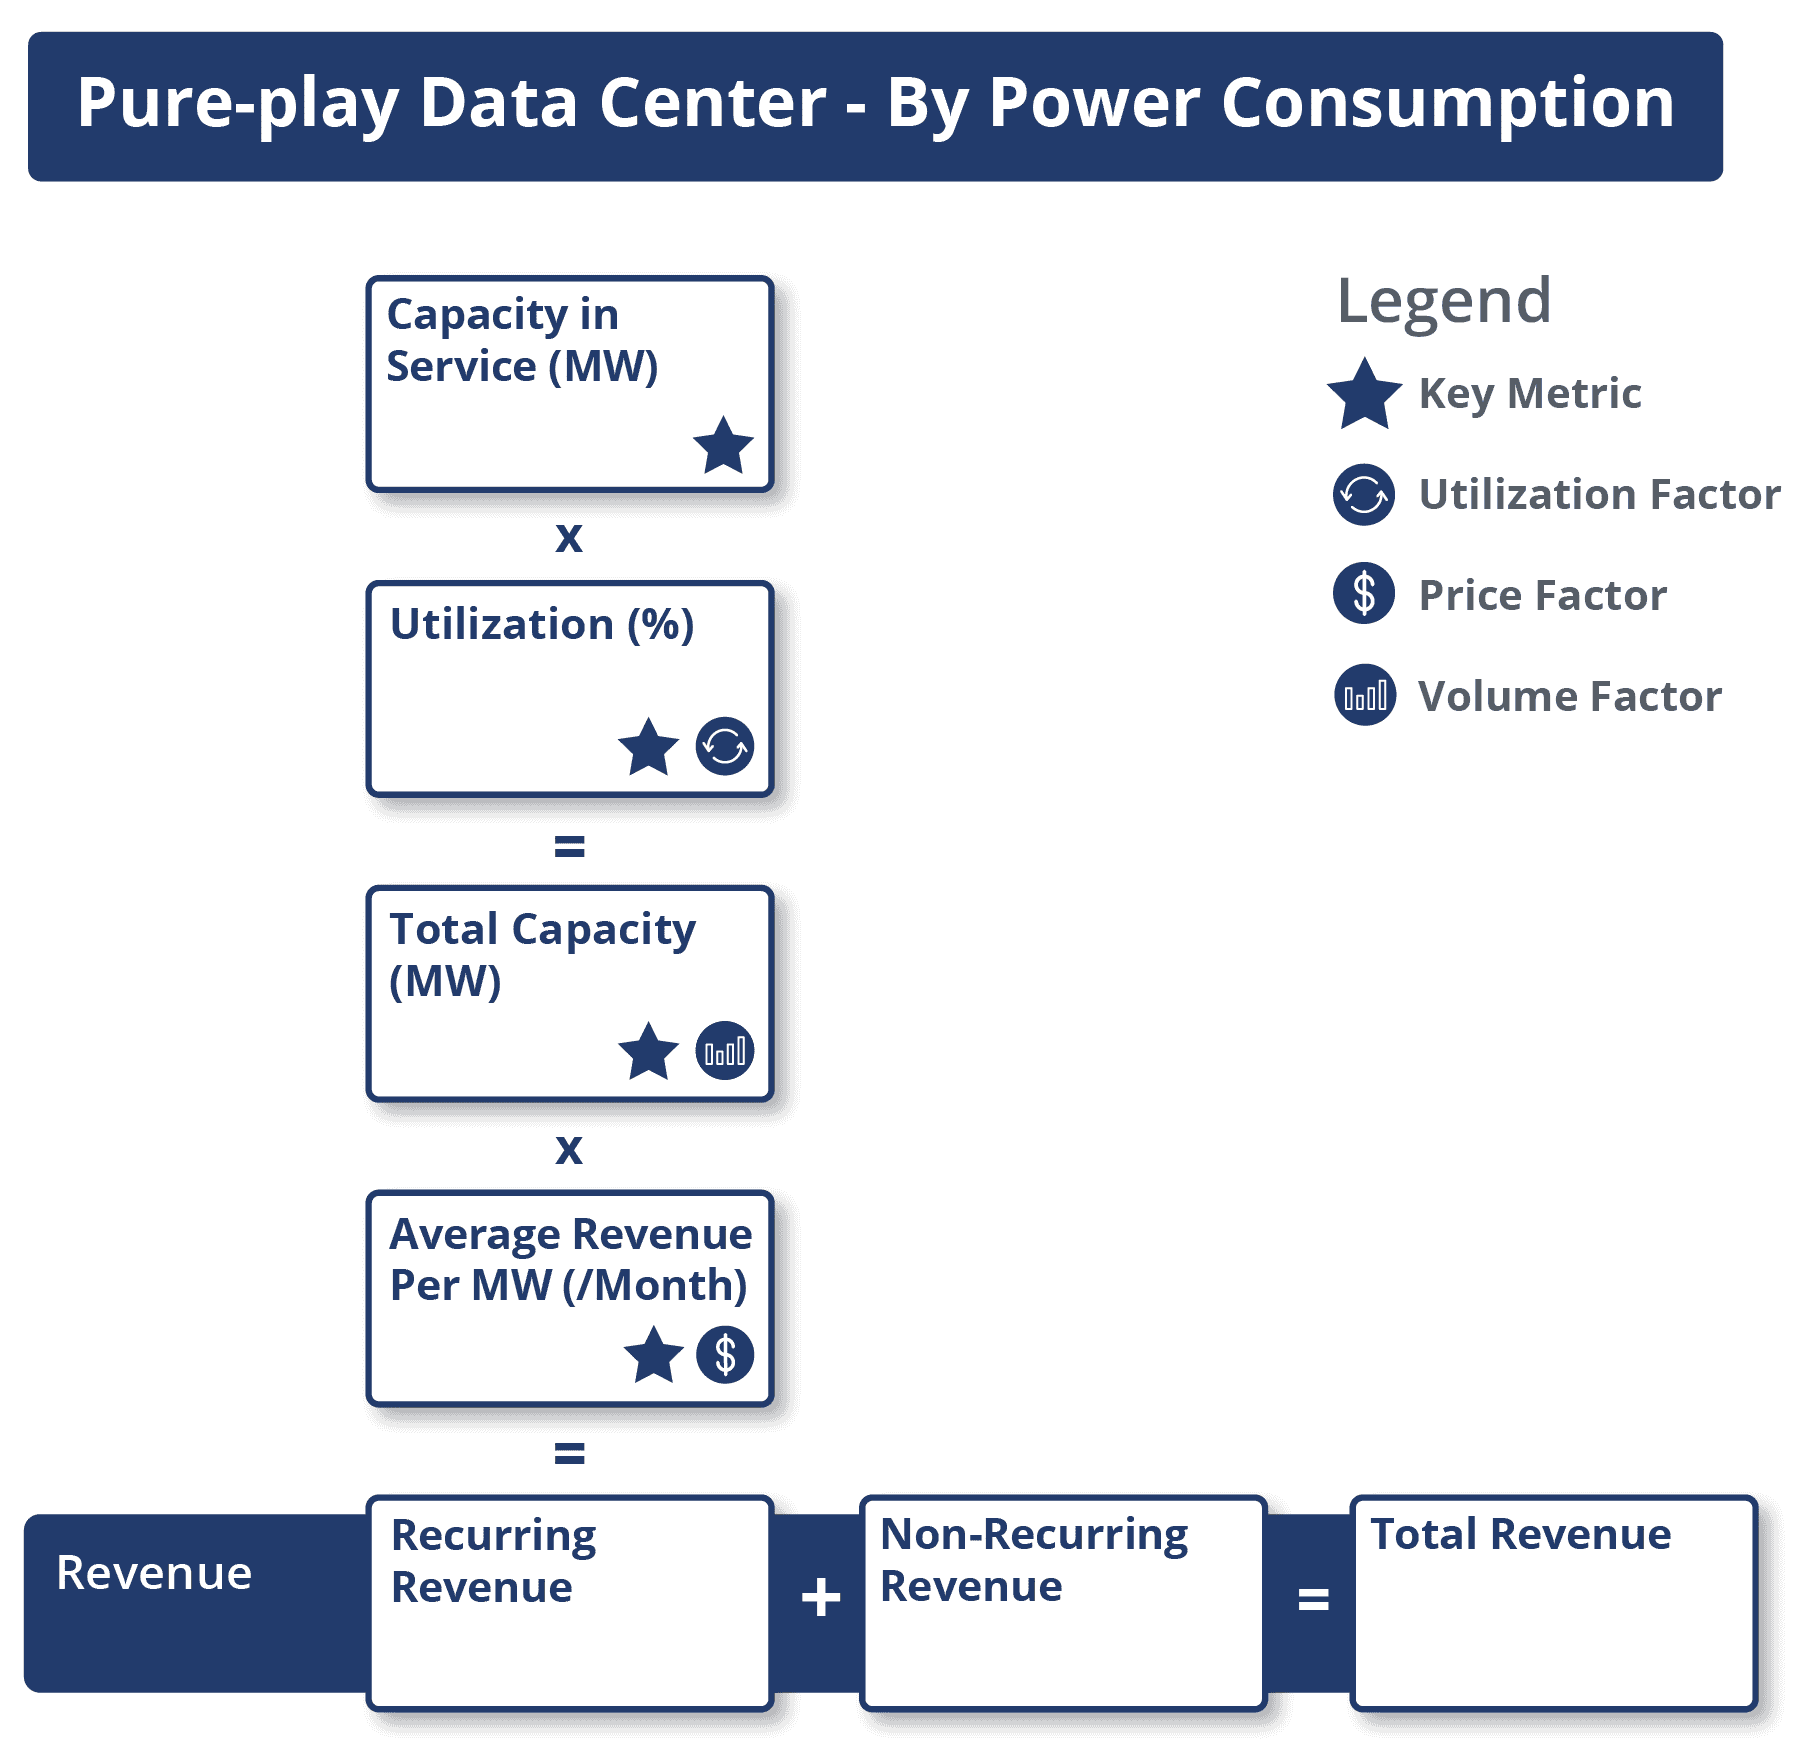
Pure-play Data Center – By Power Consumption
- Capacity in Service
- Utilization
- Utilized Capacity
- Average Monthly Revenue/MW
Data Center REITs
- Portfolio Occupancy Rate (%) / Capacity Utilization Rate (%)
- Total Square Feet in Service (Ksq Ft/M)
- Square Feet of Expiring Lease (K)
- Average Cost of Debt (%)
Data Center Business Model
-
Expenses
-
Revenue
-
Other Key Operational and Business Metrics
Expenses for pure-play data centers and data center REITs include utility costs, rent expenses, employee payrolls, real estate taxes and insurance, electricity sales, and marketing expenses, and research and development expenses. Some major expenses include:
- Property maintenance and repair expenses are expenses related to repairs and maintenance of the real estate property, management fees, utilities, and insurance costs.
- Capital expenditures (Capex) – The data center industry is a capital-intensive industry that requires a substantial amount of capex for the development and overall modernization of a data center. This makes capex a major expense for a data center.
In this guide, we’ve divided the data center industry into two main categories based on their business models. These categories include:
- Pure-play data centers
- Qualified Data center REITs
Analysts model pure-play data center companies based on either power consumption or capacity. For simplicity, we explain the business model of data centers by diving into three business models; Pure-play Data Centers – Capacity, Pure-play Data Centers – Power Consumption, and Qualified Data Center REITs.
Pure-play Data Centers – Capacity
Pure-play data centers generate revenue by providing colocation, interconnection, managed, and other related services to their customers/tenants and charging a margin for the services rendered. They charge their customers fees for the area (square footage) occupied, power consumed, interconnections, and other aligned services. Revenue generated by pure-play data centers can be bifurcated into recurring and non-recurring revenue. Recurring revenue mainly comprises colocation, interconnection, managed infrastructure, and other revenue.
Colocation services involve providing companies with physical space, power, and security to host their critical applications and workloads in an integrated ecosystem. Colocation spaces are offered under fixed duration contracts (typically three years) and billed monthly generating monthly recurring revenue (MRR). Colocation revenue is calculated as the average number of billing cabinets multiplied by monthly recurring revenue (MRR) per cabinet. A cabinet is like a rack in that it can hold assorted modules for electronic equipment. Further, the average billing cabinet is computed by multiplying the average cabinet capacity by the utilization (%).
Interconnection is a point-to-point cable link between two or more cabinets within a data center or between two different data centers. With interconnection, clients receive a fast, convenient, and affordable integration with their partners and service providers. They also receive highly reliable and extremely low-latency communication, system integration, and data exchange. Revenue generated from rendering these services falls under interconnection revenue.
Interconnection revenue is calculated as average cross connects multiplied by MRR per interconnection. A cross-connect is a physical direct connection between two different termination locations. Recurring revenue also includes revenue from offering managed infrastructure services, and other revenue earned by the data center.
Non-recurring revenue primarily comprises installation services related to a customer’s initial deployment and professional services.
Pure-play Data Centers – Power Consumption
Similar to the capacity-based business model, revenue generated by pure-play data centers is modeled based on power consumption and can also be bifurcated into recurring and non-recurring revenue. Here, however, recurring revenue is computed as total utilized capacity (megawatt, MW) multiplied by average revenue per MW (/month). Further, total utilized capacity (MW) is calculated as total capacity (MW) multiplied by utilization rate. Average utilized capacity (MW) is the sum of total utilized capacity MW (current period) and total utilized capacity MW (previous period) divided by 2.
Qualified Data Center REITs
Data centers REITs generate revenue from rendering rental services, tenant reimbursement, interconnection, and other related services. Together, rental revenue, tenant reimbursement revenue, interconnection revenue, and other revenue account for total REITs revenue. Total rental revenue is calculated as the average area utilized (sqm/sqft) multiplied by the monthly service revenue per sqm/sqft (MSR). Further, the average area utilized (sqm/sqft) is the product of the area in service (sqm/sqft) and utilization (%).
Qualified Data Center REITs
Some key metrics applicable to data center REITs include:
- Funds from operations (FFO) is a measure of operating and financial performance and is calculated as net income applicable to common stockholders excluding non-cash adjustments.
- FFO payout ratio helps investors to understand dividend payment as a percentage of earnings and is calculated as total dividends paid divided by funds from operations.
- Adjusted funds from operations (AFFO) is a financial measure used to estimate the value of a real estate investment trust (REIT) and is calculated as FFO excluding capital expenditures and maintenance capex.
- AFFO payout ratio helps to understand dividend payment as a percentage of its earnings and is calculated as total dividends paid divided by adjusted funds from operations over the same period.
Available Comp Tables - Consensus Estimates
Visible Alpha offers one data center-related comp table, comparing forecasts for key financial and operating metrics, to make it easy to quickly conduct relative analysis, whether you are interested in looking at key values for global data centers, Americas, or Europe. Every pre-built, customizable comp table is based on region, sub-industry, or key operating metrics.
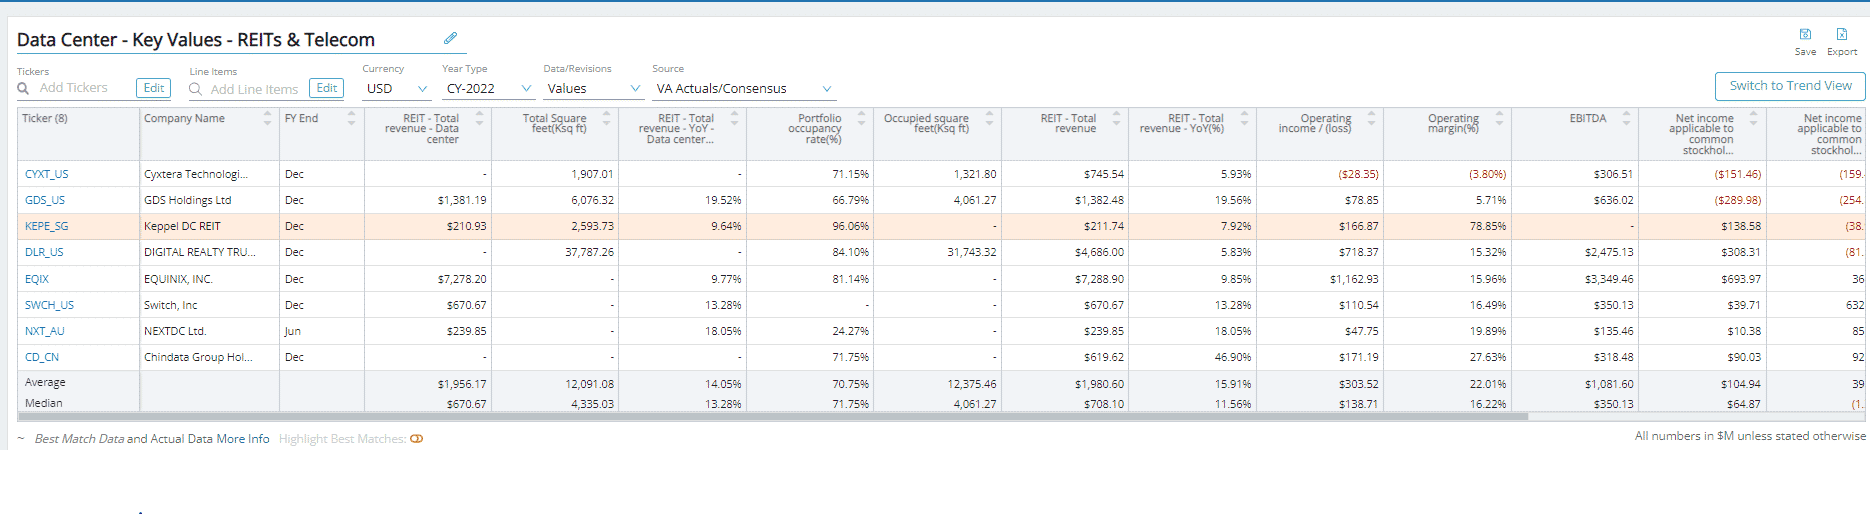
Global Financial and Operating KPIs Company Examples:
Pure-Play Data Center
- Cyxtera Technologies Inc (CYXT_US)
- GDS Holdings Ltd (GDS_US)
- Switch, Inc (SWCH_US)
- NEXTDC Ltd. (NXT_AU)
- Chindata Group Holdings Ltd (CD_CN)
Qualified Data Center REITs
- Keppel DC REIT (KEPE_SG)
- DIGITAL REALTY TRUST INC. (DLR_US)
- EQUINIX, INC. (EQIX)
Download Report
This guide highlights the key performance indicators for the data center industry and where investors should look to find an investment edge, including:
- Data Center Business Model & Diagram
- Key Data Center Metrics PLUS Visible Alpha’s Standardized Industry Metrics
- Available Comp Tables
- Industry KPI Terms & Definitions