


Guide to Commercial Vehicles Industry KPIs
This guide highlights the key performance indicators for the commercial vehicle industry and where investors should look to find an investment edge.
Industry Overview
The commercial vehicles industry, encompassing trucks, buses, vans, and heavy-duty vehicles, is a critical segment of the transportation and logistics sectors. It includes light commercial vehicles (LCVs) like vans and pickups, medium and heavy commercial vehicles (M&HCVs) such as trucks and buses, and specialized vehicles like refrigerated trucks. This sector is essential for supporting supply chains, public transportation systems, and the global economy.
The industry’s economic importance is clear: commercial vehicles are essential for goods movement across virtually every industry, from retail to construction. They not only support businesses but are also foundational to public services, including city transit and waste collection. Growth in the sector is closely linked to broader economic cycles, with demand typically rising during periods of economic expansion and stabilizing or contracting during downturns. However, the industry’s strong reliance on diesel-based vehicles has made it a focal point for regulatory scrutiny, as governments worldwide push for cleaner alternatives to meet emissions reduction targets.
Major commercial vehicle industry players include global automotive giants like Daimler, Volvo Group, Traton SE, Iveco Group, and Sinotruk, as well as specialized manufacturers such as Paccar. Additionally, new entrants focusing on electric and autonomous vehicles, like Rivian have garnered attention.

Key Commercial Vehicles Industry Metrics
Key performance indicators (KPIs) are the most important business metrics for a particular industry. When understanding market expectations for the commercial vehicle industry, whether at a company or industry level, some KPIs to consider include:
- Volume - Trucks
- Volume - Buses
- Volume - Commercial Vehicle (CV)
- Average selling price (ASP) - Trucks
- Average selling price (ASP) - Buses
- Average selling price (ASP) - Commercial Vehicle (CV)
- Total Revenue - Commercial Vehicle (CV)
- Total Revenue - Financial Services
- Operating Margin
- EBITDA Margin
- Operating Income/(Loss)

Commercial Vehicles Industry Business Model
-
Expenses
-
Revenue
-
Profitability
The commercial vehicles industry is highly capital- and labor-intensive, with significant costs tied to manufacturing, regulatory compliance, R&D, and digital transformation. Key expense categories include:
- Selling, general, and administrative (SG&A) expenses: These expenses vary by company, and may also depend on the company’s size, revenue, and target market. The industry’s move toward electrification, autonomous technology, and sustainability brings additional costs and complexity.
- Research and development (R&D) expenses: R&D investments are critical for maintaining competitive advantage. They enable manufacturers to innovate, meet evolving market demands, and comply with stringent environmental and safety standards.
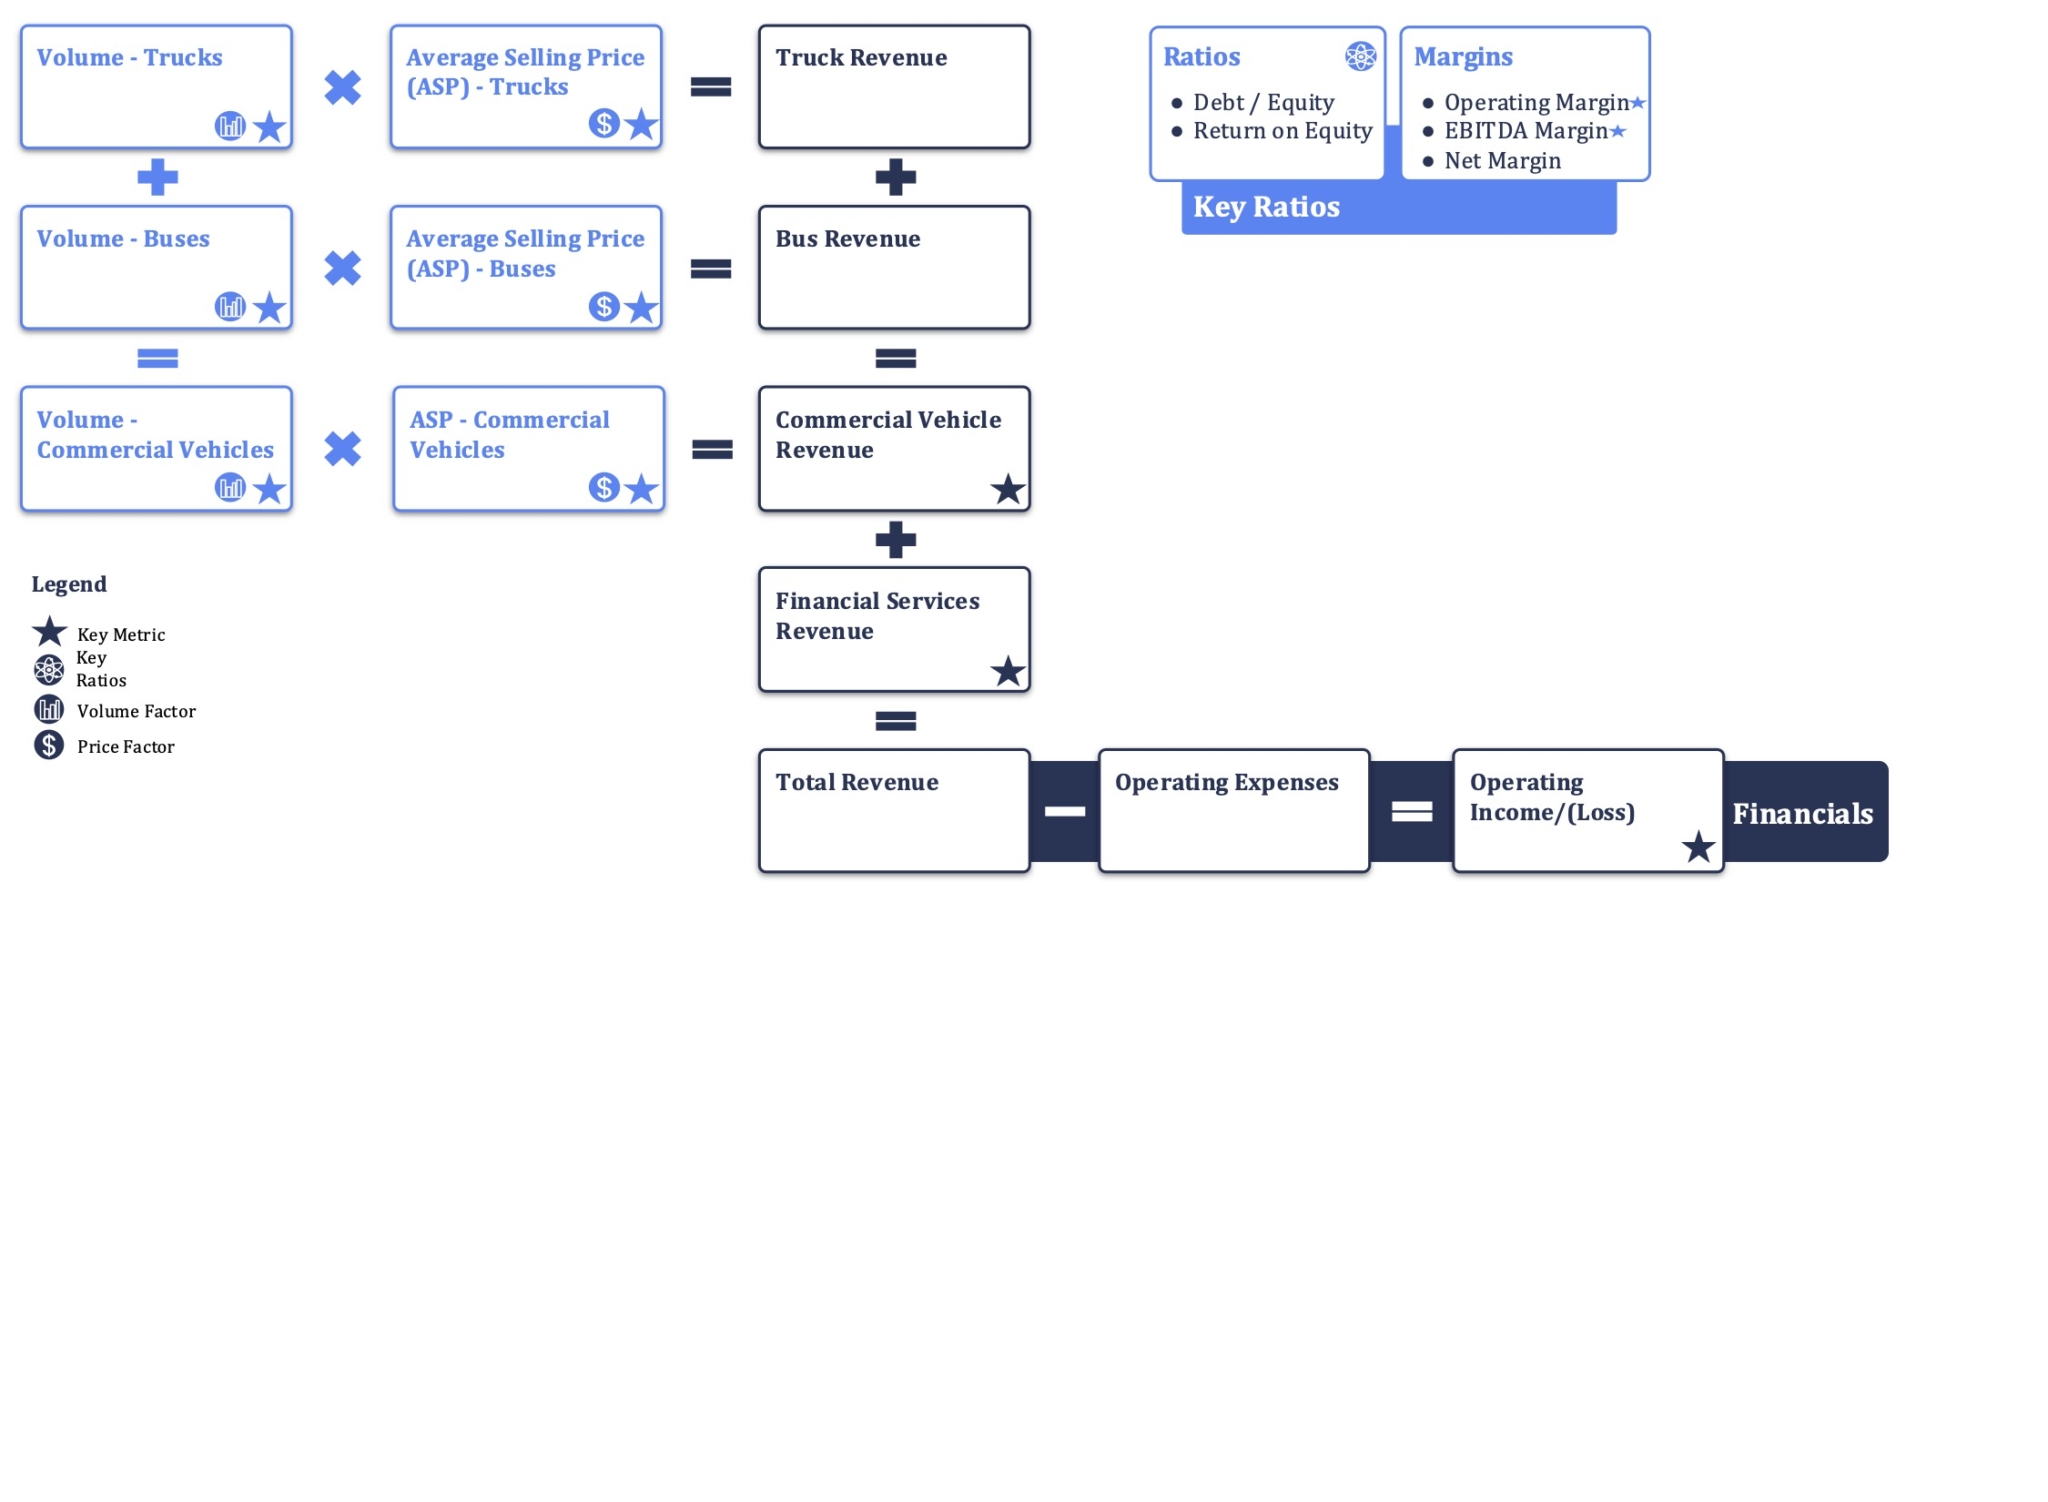
Commercial vehicle manufacturers generate revenue through three primary streams: direct sales of commercial vehicles, financial services, and service-based offerings tailored for logistics, transportation, and industrial clients. Commercial vehicle sales form the largest portion of revenue, encompassing the production and sale of trucks, buses, and other commercial vehicles. Revenue is driven by sales volume and the average selling price (ASP), both critical metrics that reflect the pricing strategy and market demand. Tracking ASP and volume helps companies gauge revenue trends and adjust pricing, production, and marketing for improved profitability.
Revenue from vehicle sales is calculated as the product of unit volumes and ASP. Alternatively, the revenue generated from the production and sales of trucks and buses can be added together to calculate the revenue of the commercial vehicle segment.
Both truck revenue and bus revenue are determined by multiplying their respective ASPs with the volume or units of trucks and buses sold. Here, ASP measures the average price at which commercial vehicles (trucks and buses) are sold during a given period while volume measures the number of commercial vehicles sold during a given period.
It is important to note that volume, which represents the actual number of vehicles produced during a specific period, may not always align perfectly with the number of units sold. However, there can be a difference between the two.
Beyond vehicle sales, financial services represent a significant revenue stream. Through in-house financing and leasing, companies earn interest and fees while offering added value to customers. In addition to financing, the financial services segment may also offer insurance products, such as vehicle warranties, GAP (guaranteed asset protection) insurance, and liability insurance. This provides additional revenue streams and allows auto manufacturers to offer a one-stop-shop experience for their customers. The financial services segment is highly regulated and subject to various laws and regulations that commercial vehicle manufacturers must comply with, depending on where they operate.
After-sales services, including maintenance, repairs, and spare parts, further bolster revenue. These offerings are supported by extensive networks of authorized service centers and create opportunities for upselling extended warranties, accessories, and other add-ons. By fostering customer loyalty, after-sales services help manufacturers establish long-term revenue streams.
Profitability in the commercial vehicles industry hinges on operational efficiency and strategic cost management, particularly in navigating the capital-intensive nature of the business. Key metrics include:
- Operating profit margin (EBIT margin): This margin reflects the company’s ability to generate profits from core operations relative to revenue.
- EBITDA margin: Offers a view of operating performance by excluding non-cash and interest-related expenses.
- Return on assets (ROA): Assesses how effectively the company utilizes its assets to generate profit.
- Return on equity (ROE): Evaluates profitability relative to shareholders’ equity, indicating how well equity capital is deployed.
- Return on invested capital (ROIC): Measures the company’s ability to generate returns on its total invested capital, encompassing both debt and equity.
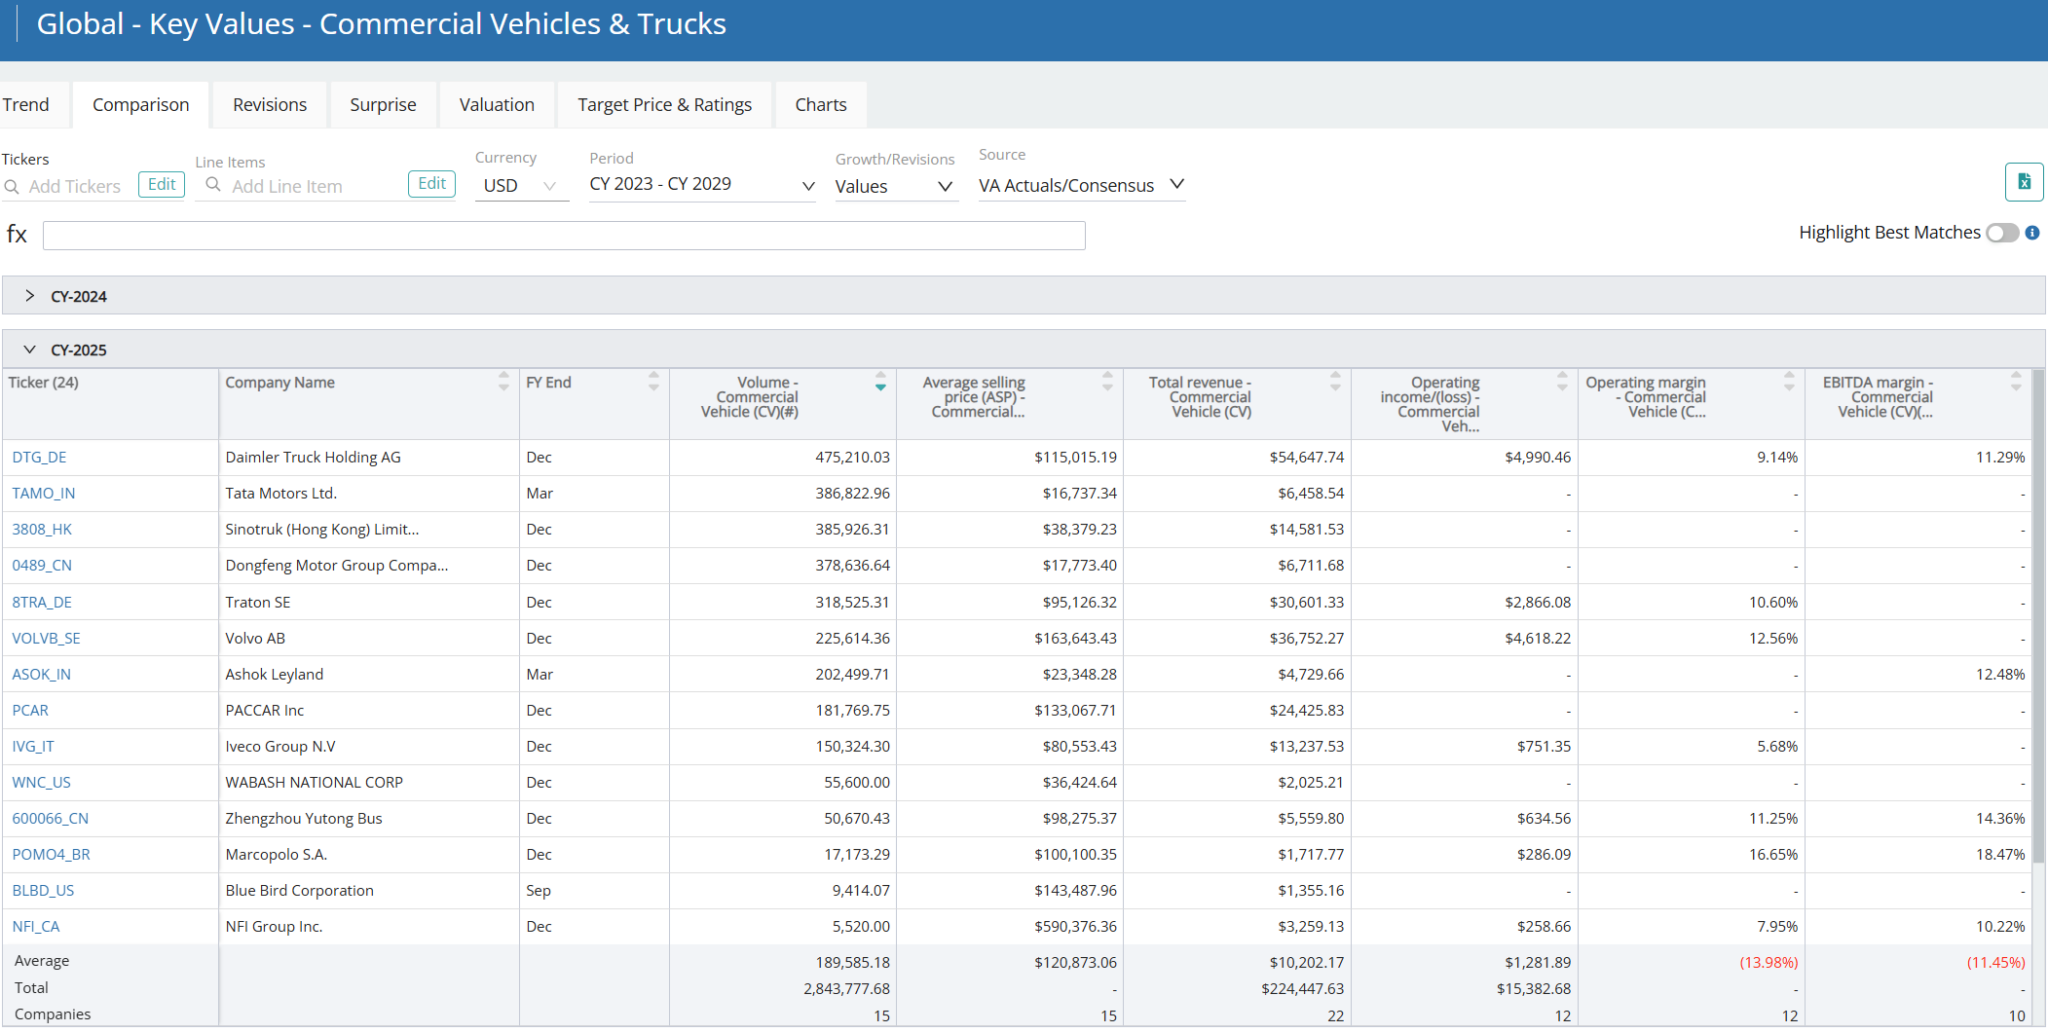
Available Comp Tables - Consensus Estimates
Visible Alpha offers 13 commercial vehicle-related comp tables, comparing forecasts for key financial and operating metrics, to make it easy to quickly conduct relative analysis. Every pre-built, customizable comp table is based on region, sub-industry, or key operating metrics.
Global Financial and Operating KPIs Company Examples:
North America
- PACCAR Inc (NASDAQ: PCAR)
- Wabash National Corporation (NYSE: WNC)
- NFI Group Inc (TSE: NFI)
- Workhorse Group Inc (NASDAQ: WKHS)
EMEA
- Volvo AB (STO: VOLV-B)
- Daimler Truck Holding AG (ETR: DTG)
- Traton SE (ETR: 8TRA)
- Iveco Group N.V (BIT: IVG)
- Ebusco Holding N.V. (AMS: EBUS)
APAC
- Sinotruk (Hong Kong) Limited (HKG: 3808)
- Zhengzhou Yutong Bus (SHA: 600066)
- Hino Motors (TYO: 7205)
- Ashok Leyland (NSE: ASHOKLEY)
Download Report
This guide highlights the key performance indicators for the commercial vehicles industry and where investors should look to find an investment edge, including:
- Commercial Vehicles Industry Business Model & Diagram
- Key Commercial Vehicles Industry Metrics PLUS Visible Alpha’s Standardized Industry Metrics
- Available Comp Tables
- Industry KPI Terms & Definitions