


Guide to Cement KPIs
This guide highlights the key performance indicators for the cement industry and where investors should look to find an investment edge.
Industry Overview
The building and construction materials industry plays a pivotal role in the construction sector, providing essential materials and products for various types of construction projects, supporting infrastructure development, and the construction of residential, commercial, and industrial buildings. The industry encompasses a range of materials and products, including cement, concrete, aggregates, gypsum, limestone, and more.
Within the building and construction materials industry, various companies engage in the production and supply of materials used in construction projects. Examples of key companies in this industry include:
- Cement Manufacturers
- Concrete Manufacturers
- Aggregate and Sand Suppliers
- Roofing Material Manufacturers
These are just a few examples, and the building and construction materials industry is diverse, involving numerous other specialized manufacturers and suppliers. The figure below illustrates some key suppliers of products for building and construction material companies by industry, along with key users or customers for these companies.
In this guide, we primarily focus on cement, aggregate, and concrete manufacturers that constitute a large portion of the larger building and construction materials industry.
The cement industry is a crucial component of the construction sector and plays a fundamental role in infrastructure development. The industry is cyclical and influenced by factors like population growth, urbanization, and government infrastructure investments. It is made up of regional markets rather than a single national selling market. No single company possesses a distribution network of plants extensive enough to cater to all geographic areas. As a result, profitability is highly responsive to shifts in regional supply and demand dynamics.
Cement production is energy-intensive and is subject to various environmental and safety regulations to mitigate its impact on the environment and ensure worker safety.

Key Cement Industry Metrics
Key performance indicators (KPIs) are the most important business metrics for a particular industry. When understanding market expectations for the building & construction materials industry, whether at a company or industry level, some KPIs to consider include:
- Production Volume
- Capacity
- Volume Sold
- Average Realized Price
- Cash Cost Per Unit
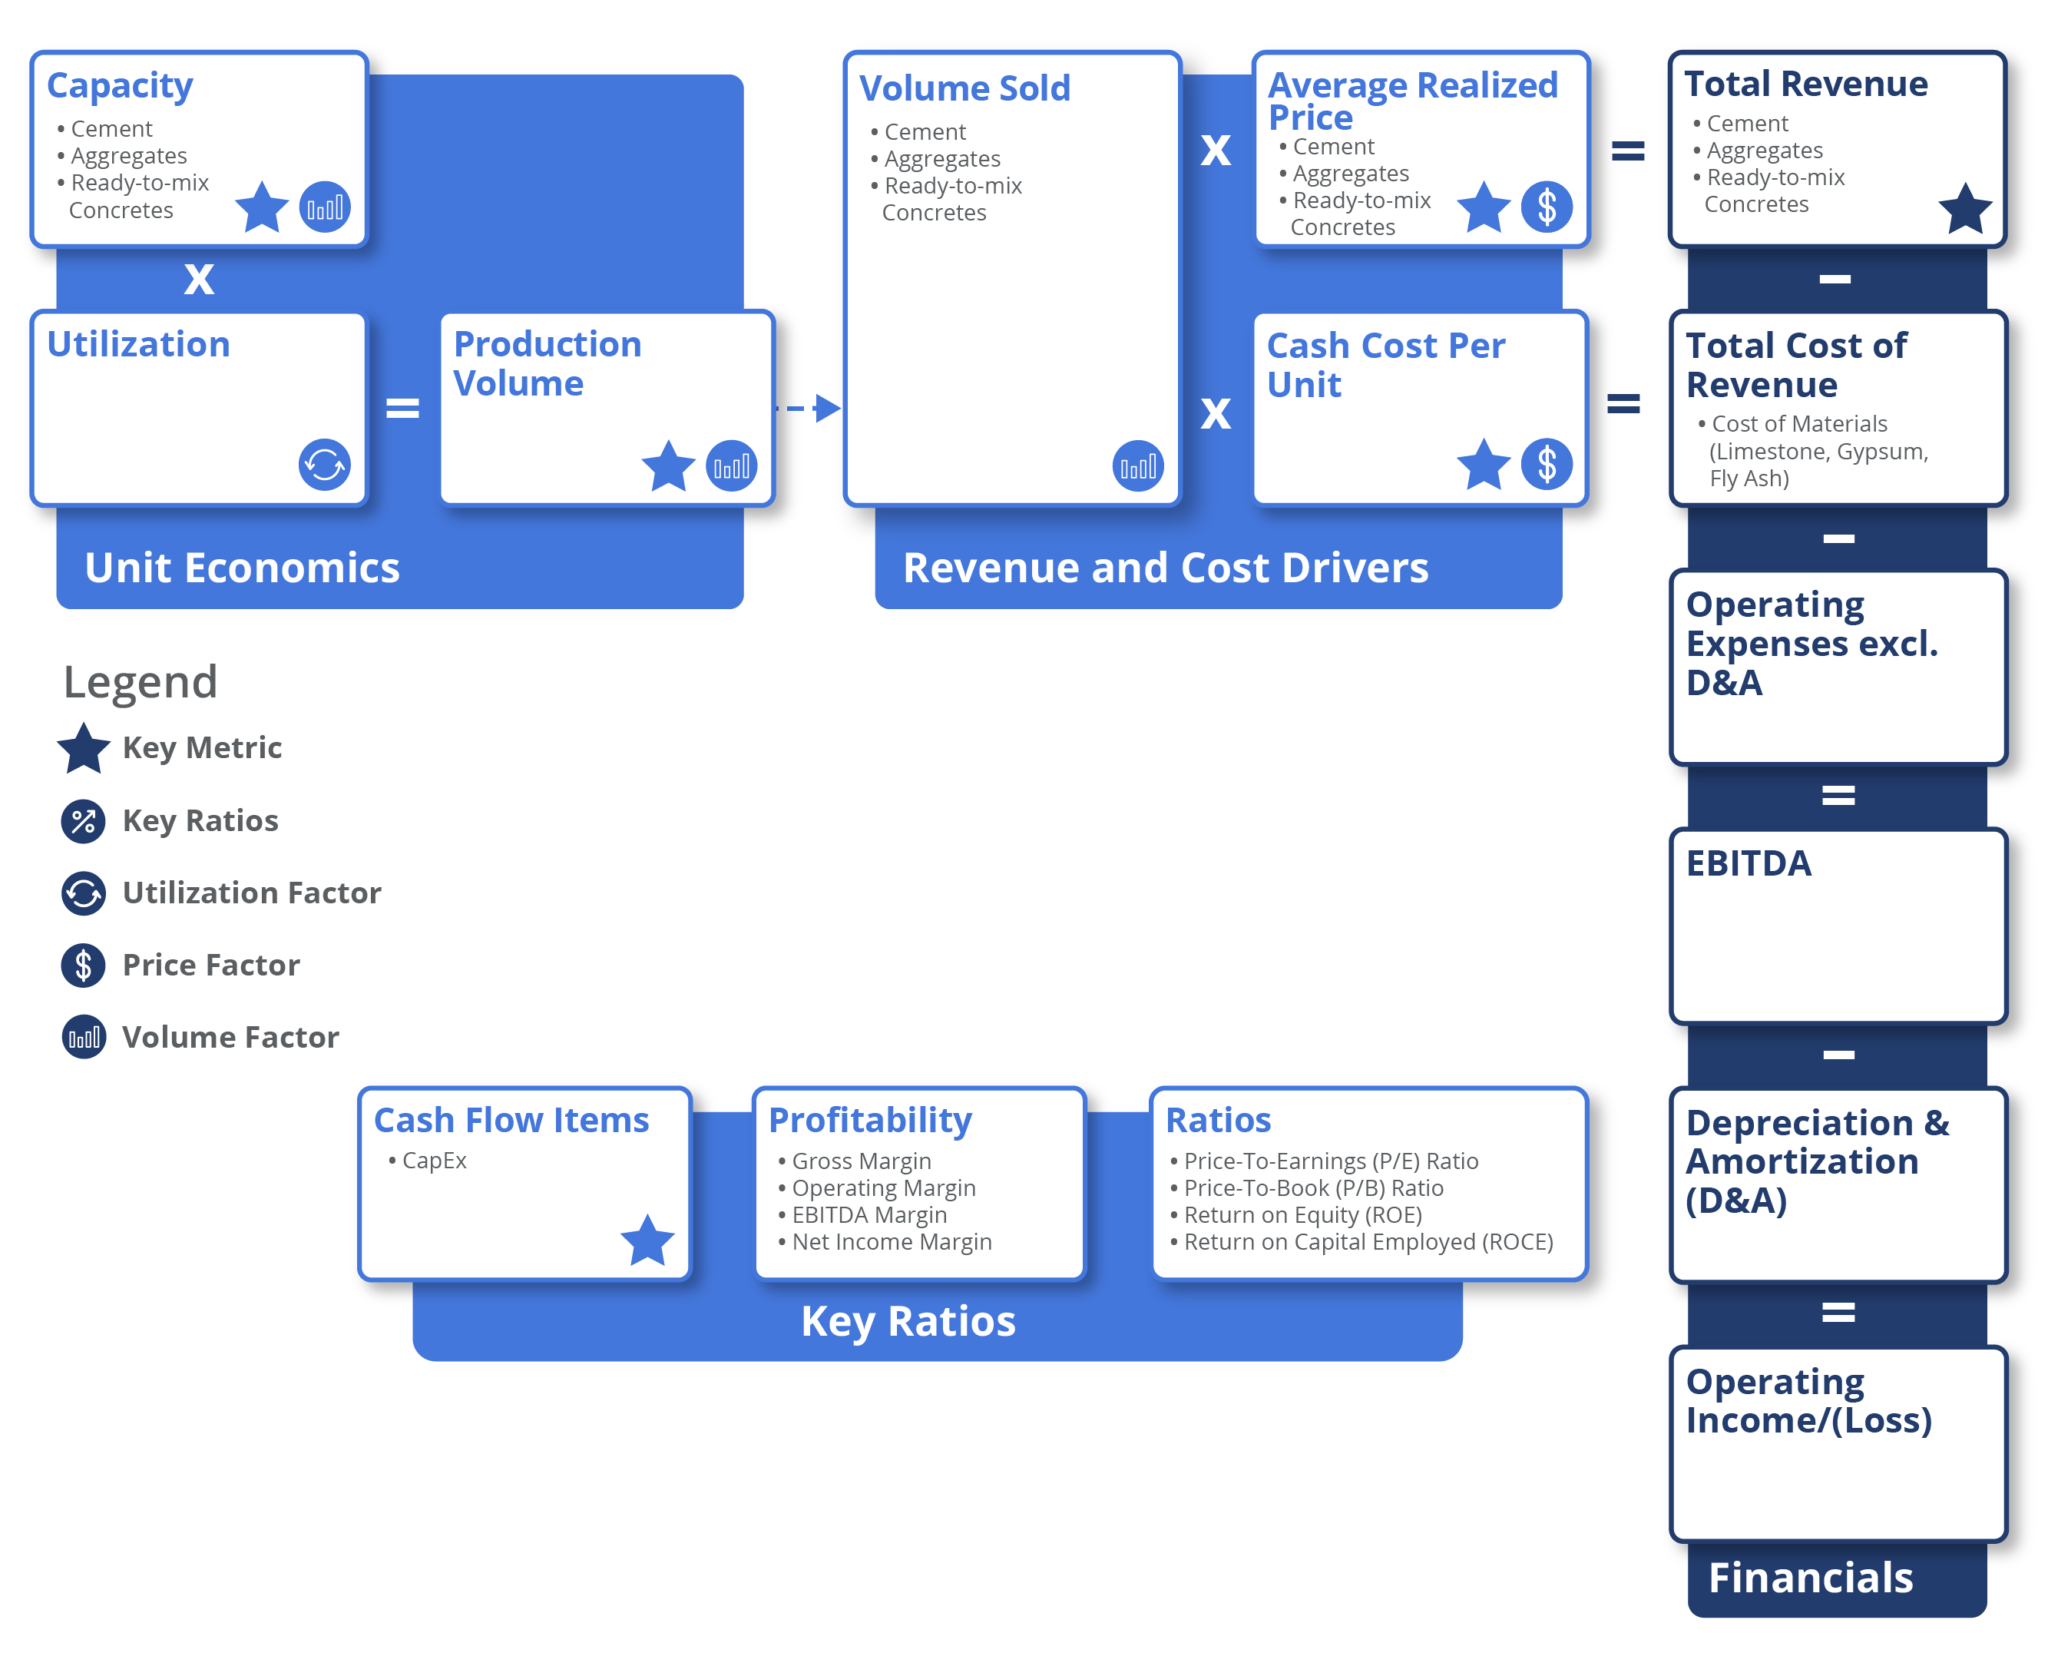
Cement Industry Business Model
-
Expenses
-
Revenue
-
Profitability
Key expenses for companies in this industry include power & fuel, raw materials, transportation, and labor costs. To calculate a company’s total costs, each cost component is calculated on a per-unit basis and then multiplied by sales volume or volume sold.
Power and fuel account for around 25-30% of the total cost of sales of cement companies. Many manufacturing processes in the construction materials industry, such as the firing of kilns in cement production, require significant energy inputs, usually in the form of coal. Building and construction materials companies use heavy machinery and equipment for various processes, such as crushing, grinding, and mixing raw materials. Operating and maintaining these machines require considerable energy, often in the form of electricity or fuel.
The power needs of cement plants vary based on the treatment process employed, namely the dry process or wet process. In the wet process, producing one tonne of cement requires nearly 1,300-1,600 kcal/kg of clinker and 110-115 kWh of power. Conversely, the dry process involves 720-990 kcal/kg of clinker and 95-110 kWh of power to manufacture the same quantity of cement.
Raw materials account for around 20-25% of the total cost of sales of cement manufacturers. Common raw materials include gypsum, limestone, fly ash, and slag, among others. Notably, limestone constitutes a significant portion of this cost. Cement plants are generally located near limestone quarries due to the impracticality of transporting limestone over long distances. Gypsum, a naturally occurring substance, is readily available and can be sourced from seawater or chemical plants. Fly ash, a finely powdered glass-like material, is recovered from gases produced in coal-fired electric power generation. It primarily consists of silica, alumina, and iron. Slag, used by cement manufacturers, is generated during the separation of molten steel from impurities in steel-making furnaces.
Selling expenses: Since cement is a low-value, high-volume commodity, transportation costs constitute another major proportion of the total cost of sales for building and construction materials companies. The cement industry predominantly relies on three major modes of transport: road, rail, and sea. Given the bulk nature of cement as a commodity, the expense associated with transporting it to sales terminals constitutes a substantial portion of the overall manufacturing cost, exceeding 10% of the total cost.
To address transportation costs, many cement plants strategically position themselves near limestone or other raw material reserves.
As a result, the proximity of a cement plant to its raw material sources and the consequential transportation costs directly impact the plant’s competitiveness and profitability. Balancing these factors is crucial for optimizing the overall efficiency and cost-effectiveness of the cement manufacturing process.
Other expenses associated with the cement industry have a lot to do with the fact that the cement industry stands out as one of the most polluting industries, contributing significantly to greenhouse gas emissions. To address this issue, manufacturers are compelled to invest substantial capital in emission reduction measures. Furthermore, with the potential implementation of a carbon border tax (essentially taxing products from countries with high pollution levels), there is a prevailing trend among European and American companies to minimize their involvement in these markets by divesting their assets.
The most fundamental source of revenue for cement companies is the sale of construction materials and products. These companies generate their revenue primarily from three key segments:
- Cement
- Aggregates
- Concrete (Ready-to-Mix Concrete)
Cement is a major segment for building and construction material companies, especially cement manufacturers. It is one of the primary construction materials used in concrete production, which is the most widely used construction material in the world. It binds aggregates (such as sand, gravel, and crushed stone) together to create durable structures. The key stages in cement production are:
- Raw material extraction or mining from quarries
- Crushing and grinding of the extracted raw materials
- Blending and proportioning the crushed raw material to create a raw mix
- Pre-heating and clinker formation
- Cooling the clinker and then grounding it to produce cement
There are several types of cement, each designed to meet specific construction requirements and applications. The most common types include:
- Portland cement: The most common type, used in general construction.
- Blended cement: A mixture of Portland cement with other materials like fly ash or slag.
- Specialty cement: Tailored for specific applications, such as rapid-hardening cement or low-heat cement
The primary source of revenue for cement manufacturers comes from manufacturing and selling cement.
Concrete is a building and construction material made up of cement, fine aggregates (like sand), and coarse aggregates (such as gravel). Portland cement is most commonly used for making concrete. When mixed with water, the mixture of cement and aggregates solidifies over time. Achieving an appropriate water-cement ratio is crucial for producing workable concrete. As water is introduced, cement undergoes a reaction, initiating the hydration process, and thus binding the materials into a durable, stone-like substance. In building and construction, concrete has applications in various load-bearing elements like foundations, columns, beams, and slabs. For cement companies, the production and sale of concrete is another source of revenue.
Aggregates, such as sand, gravel, and crushed stone, are inert granular materials crucial for concrete production. A typical concrete mix generally consists of about 60% to 75% aggregates by volume. To ensure a high-quality concrete mix, the aggregates must possess hardness and strength and must be clean. They should be free from absorbed chemicals or coatings of clay and other fine materials, as these can lead to concrete deterioration. Aggregates are of two distinct categories; fine and coarse. Fine aggregates generally consist of natural sand or crushed stone, while gravels constitute the majority of coarse aggregate.
The total revenue of companies in this industry is a function of the sales volume of cement, concrete, and aggregates and the average realized prices of these three products. Companies generally charge customers based on the volume of cement, aggregates, concrete, and/or other materials required for a construction project.
Sales volume is determined by production volume and utilization. Production volume is calculated by multiplying capacity by utilization rate. Here, capacity refers to the maximum amount of building and construction material that can be produced over a specific period under normal working conditions. Further, utilization rate, also known as capacity utilization, is a measure of how much of the available capacity is actually being used. While production volume refers to the total quantity of cement produced, sales volume represents the total quantity of cement that a company has sold during a specific period. Although production and sales volume are generally identical in the forecast period, there may be a difference in the two values in historical data. This variance can be attributed to the inclusion of ready-mix concrete intended for internal use in historical data, thus accounting for the difference.
Average realized price refers to the average revenue generated per unit of cement, concrete, and aggregate sold. These prices are influenced by various factors, including market demand and supply, raw material costs, transportation costs, competitive pricing strategies, and economic conditions.
Note that cement and aggregate are traditionally priced and reported on a “per ton” basis, while ready-mix concrete is priced and reported on a “per cubic meter” basis.
Alternatively, revenue for companies in the cement industry can also be calculated by decomposing revenue growth to isolate the core performance of the business from the impact of mergers & acquisitions (M&A) and FX on growth, which accounts for inorganic growth. To calculate organic growth, analysts factor in volume and price growth fluctuations. The growth metrics most commonly used are volume growth, price growth, organic growth, M&A growth, and forex growth.
Multinational corporations disclose their revenue distribution by geographic regions, followed by a detailed breakdown of products within those regions. The calculation of sales volume and pricing involves estimating year-over-year changes, which can be determined by using an inflation factor. Revenue is then obtained by multiplying the sales volume and price. This approach accounts for variations in each geographical area resulting from local factors, and these differences are considered in the impact drivers, ultimately influencing both revenue and cost.
Investors assess the profitability of companies in this industry by considering various financial metrics, including:
- Gross Margin
- Operating Margin
- EBITDA Margin
- Net Income Margin
- Price-To-Earnings (P/E) Ratio
- Price-To-Book (P/B) Ratio
- Return on Equity (ROE)
- Return on Capital Employed (ROCE)
Additionally, in the Indian cement industry, cost per unit for specific costs is also used for comparison between companies.
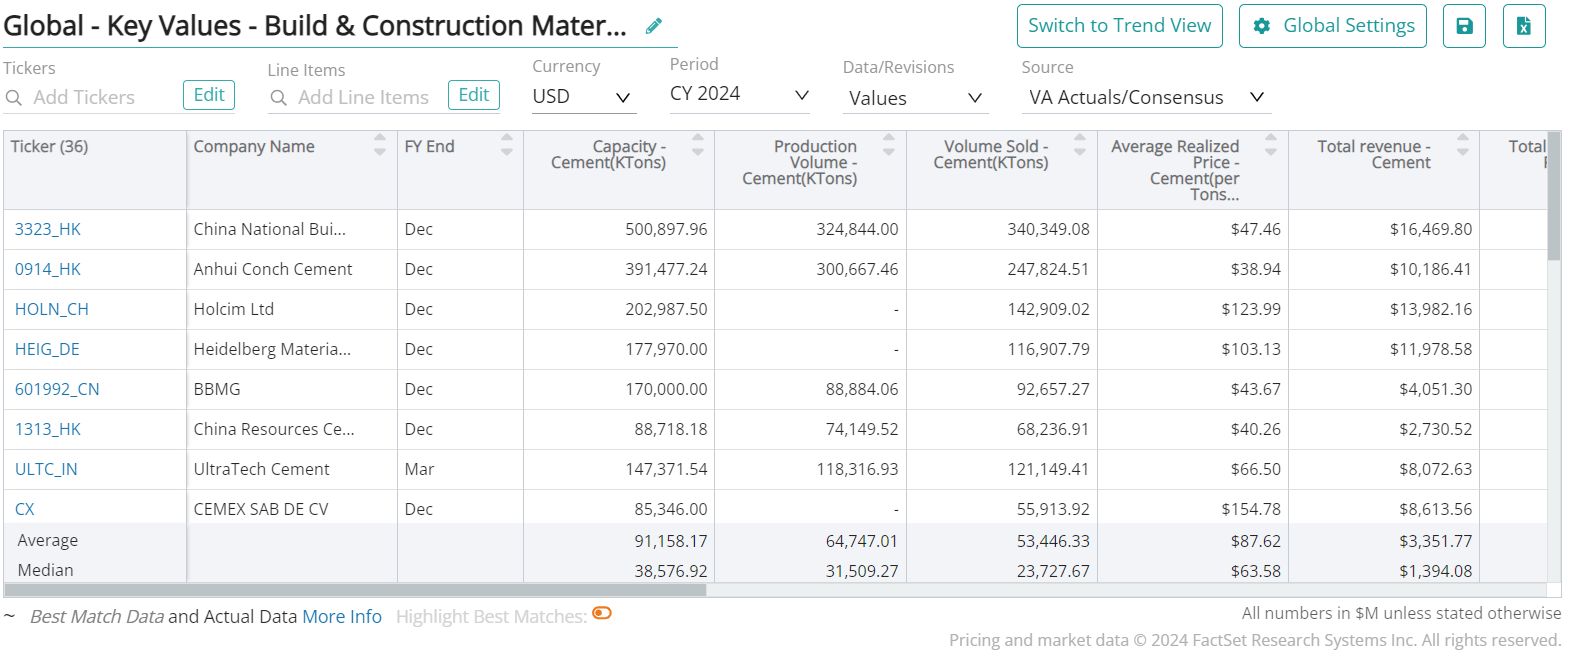
Available Comp Tables - Consensus Estimates
Visible Alpha offers 15 building & construction-related comp tables, comparing forecasts for key financial and operating metrics, to make it easy to quickly conduct relative analysis, whether you are interested in looking at key values for global companies, Americas, or Europe. Every pre-built, customizable comp table is based on region, sub-industry, or key operating metrics.
Global Financial and Operating KPIs Company Examples:
North America
- MARTIN MARIETTA MATERIALS (NYSE: MLM)
- VULCAN MATERIALS CO (NYSE: VMC)
EMEA
- CRH PUBLIC LTD CO (NYSE: CRH)
- Heidelberg Materials (FWB: HEI)
APAC
- China National Building Material (HKG: 3323)
- Anhui Conch Cement (SSE: 600585)
LATAM
- Cementos Argos (BVC: CEMARGOS)
- Grupo Cementos de Chihuahua, S.A.B. de C.V. (BMV: GCC)
Download Report
This guide highlights the key performance indicators for the cement industry and where investors should look to find an investment edge, including:
- Cement Industry Business Model & Diagram
- Key Cement Industry Metrics PLUS Visible Alpha’s Standardized Industry Metrics
- Available Comp Tables
- Industry KPI Terms & Definitions