


Guide to Beverages KPIs
This guide highlights the key performance indicators for the beverage industry and where investors should look to find an investment edge.
Industry Overview
The beverage industry consists of companies that are primarily engaged in the manufacturing, distribution, and sale of alcoholic and non-alcoholic beverages, including carbonated and non-carbonated drinks. The beverage industry consists of two major sub-industries: the alcoholic beverage industry and the non-alcoholic beverage industry.
The alcoholic beverage industry includes brewers, distillers, and vintners, involved in the production and distribution of alcoholic beverages such as beer, wine, whiskey, gin, and vodka, among others. Brewers are in the business of producing and selling beer, hard seltzer, malt-based products, and non-alcoholic beer. Distillers and vintners include companies involved in the production of alcoholic drinks such as wine, liquor, and spirits. Chinese companies classify liquor and spirits as high-end and mid-to-low-end liquor, based on their alcohol content. Distilled liquor with an alcohol by volume (ABV) of 40-60% is considered high-end liquor while liquor with an ABV of less than 20% is generally considered mid-to-low-end liquor.
The non-alcoholic beverage industry comprises companies involved in the production and distribution of carbonated drinks or soft drinks, bottled water, sports or energy drinks, juices, juice concentrates, and ready-to-drink tea or coffee. A non-alcoholic beverage has no alcohol content or, based on regional standards, could have less than 0.5% ABV. Any beverage with an ABV greater than 0.5% is considered to be an alcoholic beverage.
Beverage companies generally operate on a global scale; supply chain issues and foreign exchange volatility, therefore, have a significant impact on the revenue of these companies. Demography, disposable income growth, and product innovation are some important factors driving the long-term growth of beverage companies. In the short term, pricing, disposable income, and weather are some key factors driving growth.
On Visible Alpha’s Insights platform, the alcohol industry is bifurcated into brewers and distillers & vintners, while the non-alcoholic industry is branched out to include soft drinks, milk, tea/coffee, juices, energy drinks, and water.

Key Beverages Industry Metrics
Key performance indicators (KPIs) are the most important business metrics for a particular industry. When understanding market expectations for the beverage industry, whether at a company or industry level, some industry KPIs to consider are:
Overall Beverages
- Total Operating Expense
- Operating Income/(Lose)
Brewers
- Sales Volume*
- Sales Volume - Beer
- Average Selling Price - Beer
- Total Revenue - Volume Impact (%)
- Total Revenue - Organic Impact (%)
- Total Revenue - Forex Impact (%)
Beverages Business Model
-
Expenses
-
Revenue
-
Profitability
Two major expenses for beverage companies are the cost of goods sold and selling, general and administrative expenses. Costs of goods sold (COGS) are direct expenses, including labor, that are associated with the production of beverages. For beverage companies, COGS includes the cost of ingredients, raw materials, packaging, and other items directly involved in the production process. The bottling of beverages is a high-cost activity and investment in factories for manufacturing can be significant. COGS also includes these expenses along with freight and warehousing expenses.
Selling, general and administrative (SG&A) expenses are indirect expenses that include distribution, marketing, and sales costs. The highly competitive nature of the beverage industry ensures beverage companies spend a significant amount on marketing and advertising campaigns, making this a major expense for companies in the industry.
The global operations of beverage companies are divided by geographic classification into the Americas and other International regions. The Americas includes revenue generated from beverages sold in North America, South America, and all other regions in the Americas. North America includes revenue generated from beverages sold in the U.S., Canada, Mexico, and Central America. International includes revenue generated from beverages sold in EMEA (Europe, Middle East, and Africa), Asia Pacific, and the rest of the world.
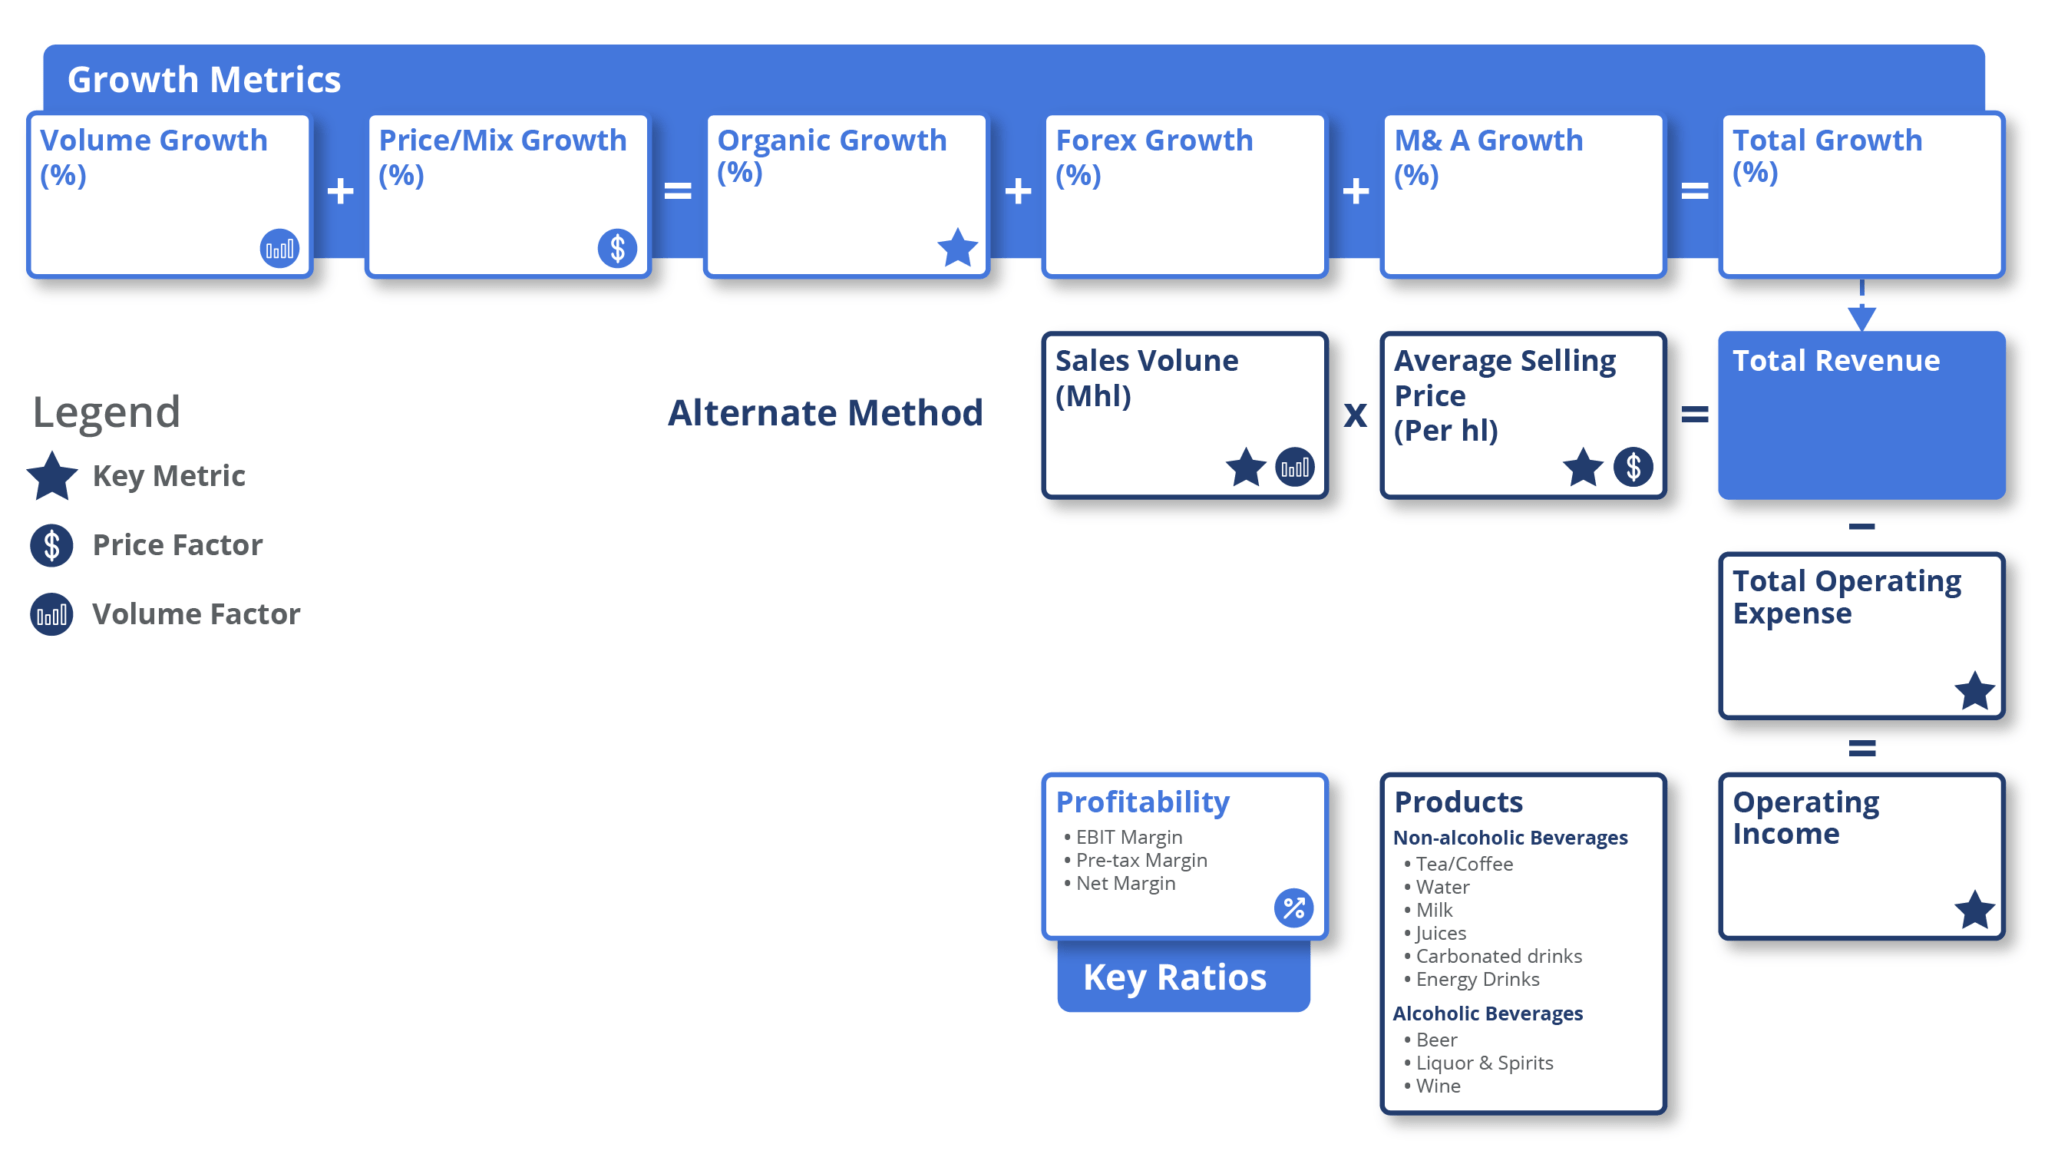
For the beverage industry revenue is calculated as volume multiplied by the average selling price (ASP) for a given period in a specific region. Alternatively, it can also be calculated by decomposing revenue growth to isolate the core performance of the business from the impact of M&A and FX on growth. The concepts most commonly used are volume growth, price growth, organic growth, acquisition/divestiture growth, and forex growth.
Volume, also called shipments, is the recorded quantity of products delivered to the customer in a given period. Volume sold can be in metric tons, barrels, liters, hectoliters (hl), or total cases delivered. Generally, a case of beer contains 24 bottles or cans. The definition of a case may differ from company to company and depending on the type of beverage. ASP indicates the price per unit of product sold which is generally represented in the form of ASP per hl, ASP per barrel, or ASP per case.
The beverage industry covers a variety of product categories. As a result, one of the main elements of this industry, volume, is measured in different units for different products. For example, the volume of milk is generally reported in thousands or millions of tonnes/liters. In the case of soft drinks and beer, which are sold in bottles, volume is reported by case. Beer can also be sold in barrels. BBL is the abbreviation for beer barrels, which is the official unit of measurement of beer volume for breweries in the U.S. 1 bbl equals 31 gallons of beer. Liquor is sold generally in tons.
For soft drinks, the volume or shipment units are reported in company-specific terms and are not comparable since some companies may report shipment of cases while others may report in units, liters, or packs. On our insights platform, we employ the following conversion for volume in order to make the KPIs comparable: 1 tonne = 1000 liters = 10 hectoliters = 8.5217 barrels.
To evaluate the profitability of companies in this industry, analysts focus on gross margins, EBIT (earnings before interest and taxes) margins, pre-tax margins, and net margins. Gross margins are particularly important due to the industry’s high raw material costs. Beverage companies with robust expense management skills generally have better gross margins.
Available Comp Tables - Consensus Estimates
Visible Alpha offers 23 beverage industry-related comp tables, comparing forecasts for key financial and operating metrics, to make it easy to quickly conduct relative analysis, whether you are interested in looking at key values for global companies, the Americas, or Europe. Every pre-built, customizable comp table is based on region, sub-industry, or key operating metrics.

Global Financial and Operating KPIs Company Examples:
Brewers
- Anheuser-Busch InBev (ABI_BE)
- Heineken (HEIN_NL)
- Asahi Group Holdings LTD (2502_JP)
- Ambev SA (ABEV)
- KIRIN HOLDINGS CO LTD (2503_JP)
Distillers and Vintners
- DIAGEO PLC (DGE_UK)
- Kweichow Moutai (600519_CN)
- Pernod-Ricard (PERP_FR)
- Wuliangye Yibin Company Limited (000858_CN)
- CONSTELLATION BRANDS, INC. (STZ)
Soft Drinks / Non-alcoholic Beverages
- PepsiCo, Inc. (PEP)
- The Coca-Cola Company (KO)
- Coca-Cola Europacific Partners plc. (CCEP)
- Keurig Dr Pepper Inc. (KDP_US)
- Coca-Cola Icecek (CCOLA_TR)
Download Report
This guide highlights the key performance indicators for beverages and where investors should look to find an investment edge, including:
- Beverages Business Model & Diagram
- Key Beverages Metrics PLUS Visible Alpha’s Standardized Industry Metrics
- Available Comp Tables
- Industry KPI Terms & Definitions