
Guide to Commercial Bank KPIs
This guide highlights the key performance indicators for the commercial banking industry and where investors should look to find an investment edge.
Industry Overview
The traditional commercial banking business consists of companies acting as financial intermediaries, collecting funds from depositors, and investing those funds in loans and securities. In addition to their credit business, banks also offer a variety of non-credit related services (e.g., money transfers, cash management, custody services, investment banking) to their retail and commercial and corporate banking clients.
Banks play a crucial role in the financial infrastructure and, as a result, are highly regulated entities. Financial regulations typically prescribe requirements for deposit reserves, liquidity, credit quality, and capital adequacy, among others.

Key Commercial Bank Metrics
Key performance indicators (KPIs) are the most important business metrics for a particular industry. When understanding market expectations for banking, whether at a company or industry level, here are some of the KPIs to consider:
- Earning Asset Yield (EAY)
- Cost of Funds (COF)
- Net Interest Margin (NIM)
- Average Earning Assets
- Average Interest Bearing Liabilities
- Non-Interest Income/Total Revenue
- Non-Performing Loans
- Coverage of Non-Performing Loans (NPLs % Allowance for Loan Losses)
- Return on Assets
- Return on Equity

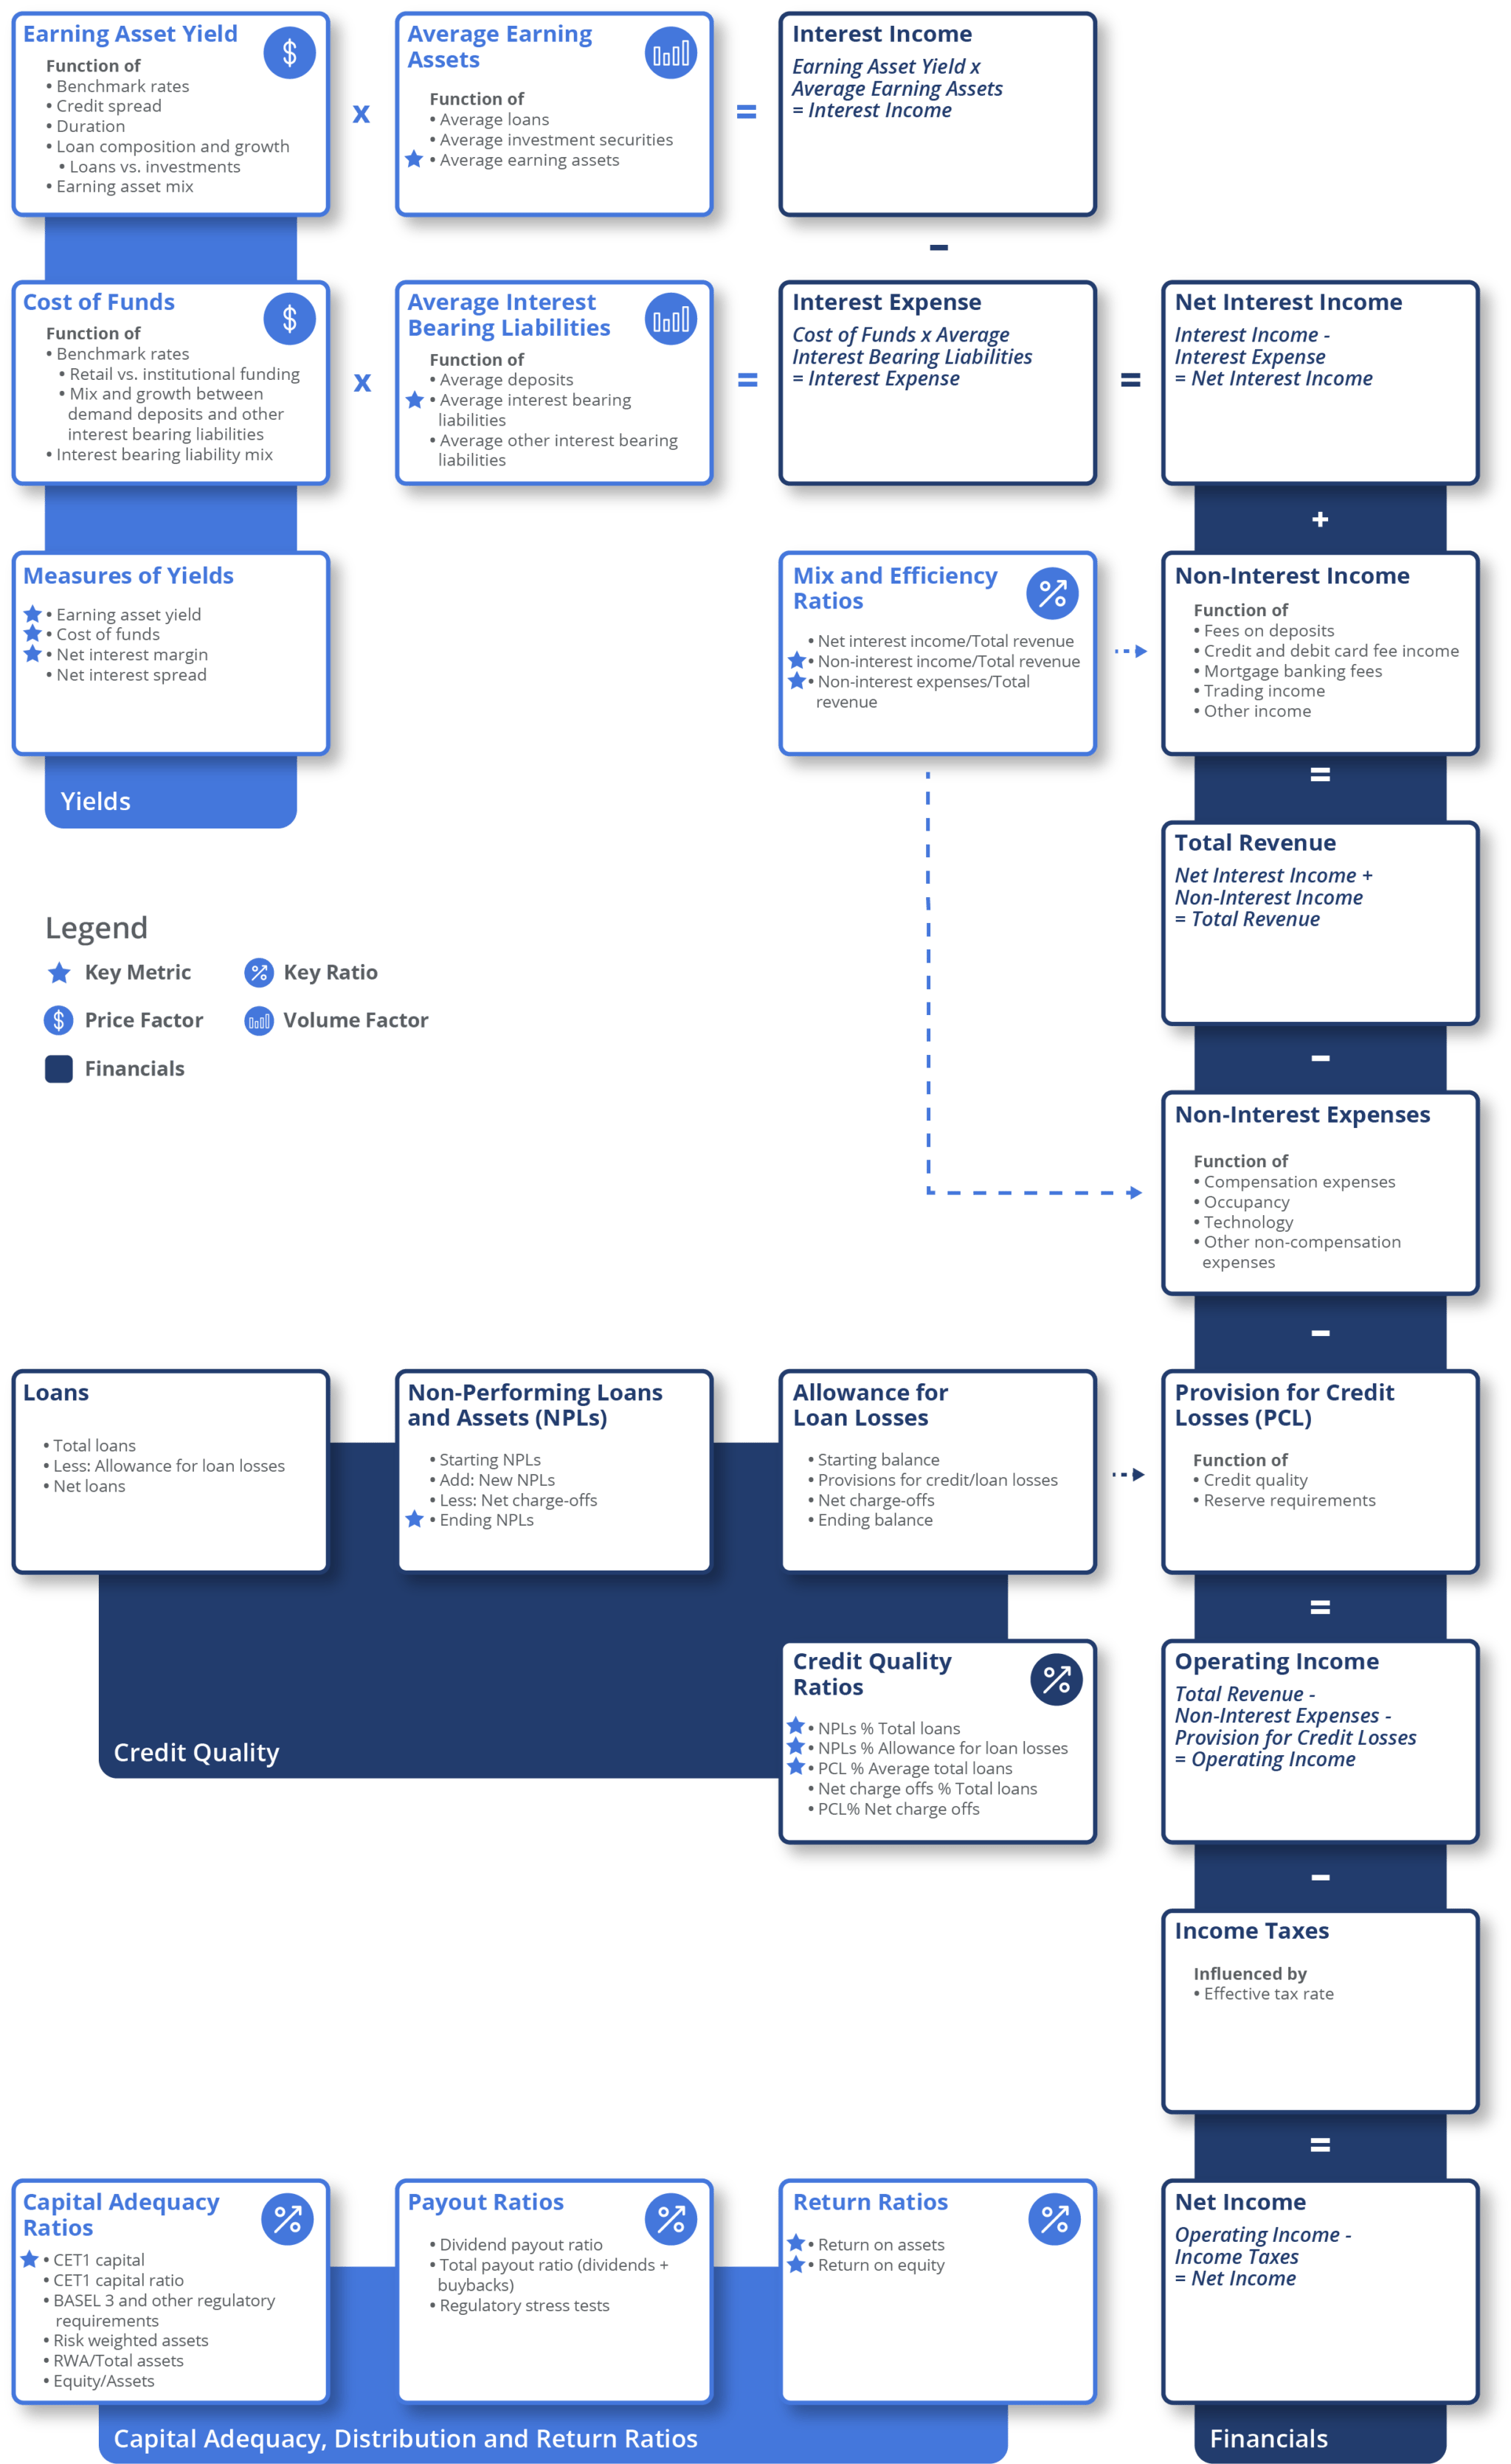
Commercial Bank Business Model
-
Expenses
-
Income
-
Credit Quality
-
Capital Adequacy
-
Profitability
Typically, compensation is the largest category of non-interest expenses. In addition to labor costs, banks also incur large expenses associated with their branch network (mainly traditional retail banks), technology infrastructure and processing costs.
Analysts evaluate the operating efficiency of a bank using the ratio of non-interest expenses to total revenue. This ratio is commonly known as the efficiency ratio in the United States and the cost-to-income ratio in other geographies. The level of this ratio, its trend (down is preferable), and how it compares to peers will help with expense analysis.
In addition to the spread business, banks also generate fee income from services provided to their retail and corporate customers and fees charged for products like credit cards and deposit accounts. Large diversified banks may also offer investment banking, asset and wealth management, and other related services.
Analysts will look at the ratio of non-interest income to total revenue to analyze revenue mix. Over the past few decades, commercial banks have increased the proportion of their revenue from non-interest sources, given its greater stability and predictability over spread-related income.
Management of credit risk is a crucial undertaking at banks. Underwriting credit includes an evaluation of the likelihood that a loan or an investment will not be repaid. Banks factor these costs into their pricing of credit by charging higher interest rates for riskier assets. Credit costs are also recognized as an expense in the income statement in the form of a provision for loan and credit losses.
Credit quality can be evaluated using several measures, of which the most common are:
- Provision for Loan and Lease Losses is the income statement expense recognized for expected credit costs. Analysts look at the size of this account, the trend and the level compared to loans or earnings. The macro-economic environment and credit cycle will play a large role in the level and trend of credit costs. A deteriorating economic environment will generally lead to an increase in credit costs.
- Loans (or assets) are classified as non-performing when they are past due by a certain amount of days (varies by country), when interest is no longer accrued or if they are in the process of being restructured.
- When non-performing loans are deemed to be permanently impaired, they are written off. The ratio of non-performing loans to total loans is used to measure the overall quality of the credit portfolio, while the ratio of NPLs to allowance for loan and lease losses will indicate the level of reserves against loan losses.
- Charge-offs are loans that have been written off in a process that removes them from the balance sheet. This account can often be found as both a gross and net value (net of credit recoveries). The ratio of charge-offs to net loans
As regulated entities, banks are required to maintain minimum capital standards, which impacts their ability to leverage their balance sheets. Higher capital requirements can decrease risk by requiring capital to absorb losses, but can also constrain asset growth and negatively impact profitability by making it more difficult to earn higher equity returns. Read More >
These capital adequacy ratios and measures are most commonly used by analysts:
- Equity % Assets is a traditional measure of leverage. This ratio has an inverse relationship with leverage in that a lower equity-to-assets ratio implies a higher level of leverage, and a higher equity-to-assets ratio suggests a lower level of leverage.
- Common Equity Tier 1 (CET1) Capital ratio is a measure of leverage used by regulators and is defined as Tier 1 Capital divided by risk-weighted assets (RWA).
- Common Equity Tier 1 (CET1) Capital is the sum of common stock (Paid-in-Capital, Additional Paid-in-Capital), retained earnings, other comprehensive income, qualifying minority interests, other qualifying capital instruments and other regulatory adjustments.
- RWAs
Analysts use asset and equity returns to evaluate and compare the profitability of banks. The two most commonly used measures of profitability are:
- Return on Assets (RoA) – defined as net income divided by assets or average assets – captures management’s ability to generate a return over the assets it controls.
- Return on Equity (RoE) – defined as net income divided by equity or average equity – measures management’s ability to generate a return on shareholders’ equity. This ratio can be compared to peers and against the cost of equity capital to identify a bank’s ability to create shareholder value. Compared to peers, capital structure and, in particular, higher capital requirements will impact excess returns.
Distributions
Available Comp Tables - Consensus Estimates
Visible Alpha offers 45 banking comp tables that compare forecasts for key financial and operating metrics to make it easy to quickly conduct relative analysis by region on yields, asset and funding mix, credit quality, capital adequacy, efficiency and profitability. All comp tables are fully customizable.

Global Financial and Operating KPIs Company Examples:
North America
- Wells Fargo (WFC)
- Bank of America Corp (BAC)
- Citigroup (C)
- Toronto-Dominion Bank (TD)
- Royal Bank of Canada (RY)
EMEA
- Santander Group (SAN)
- HSBC Holdings (HSBC)
- BNP Paribas (VA:BNPP_FR / OTCMKTS: BNPQY)
- Banco Bilbao Vizcaya Argentaria (BBVA)
LATAM
- Banorte (VA: BSMXB_MX / OTCMKTS: GBOOF)
- Itaú Unibanco (ITUB)
- Bancolombia (CIB)
- Galicia Financial Group (GGAL)
- Bradesco (BBD)
APAC
- China Merchants Bank (VA: 3968_HK / OTCMKTS: CIHHF)
- HDFC Bank (HBD)
- ICICI Bank (IBN)
- DBS Bank (VA: DBSM_SG / SGX:D05)
- Sumitomo Mitsui Financial Groups (SMFG)
Download Report
This guide highlights the key performance indicators for the commercial banking industry and where investors should look to find an investment edge, including:
- Banking Industry Business Model & Diagram
- Key Commercial Banking Metrics PLUS Visible Alpha’s Standardized Industry Metrics
- Available Comp Tables
- Industry KPI Terms & Definitions