


Guide to Auto Manufacturing Industry KPIs
This guide highlights the key performance indicators for the auto manufacturing industry and where investors should look to find an investment edge.
Industry Overview
The auto manufacturing industry comprises companies involved in the production of automobiles including passenger and commercial vehicles. Auto manufacturers typically design, manufacture, and sell vehicles produced to end consumers. The auto manufacturing process involves several stages, including research and development, engineering, manufacturing, marketing, and finally distribution.
Auto manufacturers often also have supply chain operations to source parts and materials for their vehicles, and they may have relationships with dealerships or other sales channels to distribute their products. The auto manufacturing industry is highly competitive and diverse, with numerous companies competing to develop and market new vehicles.
The industry is also characterized by significant technological innovation, with companies investing heavily in research and development to stay ahead of the competition.

Key Auto Manufacturing Industry Metrics
Key performance indicators (KPIs) are an industry’s most important business metrics. When understanding market expectations for the auto manufacturing industry, whether at a company or industry level, some KPIs to consider include:
- Units Solds - Automotives
- ASP - Automotives
- Total Revenue - Automotives
- Total Revenue - Financial Services
- EBITDA - Automotives
- Operating Margin
- EBITDA Margin
- Operating Income/(Loss) - Automotives
- Inventory Turnover Ratio

Auto Manufacturing Business Model
-
Expenses
-
Revenue
-
Profitability
A major expense for auto manufacturers is COGS or the cost of goods sold. This encompasses all direct expenses associated with producing vehicles, including raw materials, components, labor, and overhead costs directly related to the production process. Auto manufacturers must also stay competitive in terms of product design, quality, and price. This entails significant investment in research and development to stay ahead of emerging technologies and consumer trends, such as electric vehicles and autonomous driving. Some major expenses for auto manufacturers include:
- Cost of selling of goods (COGS)
- Research and development (R&D) expenses
- Selling, general, and administrative (SG&A) expenses
These expenses vary by company, and may also depend on the company’s size, revenue, and target market.
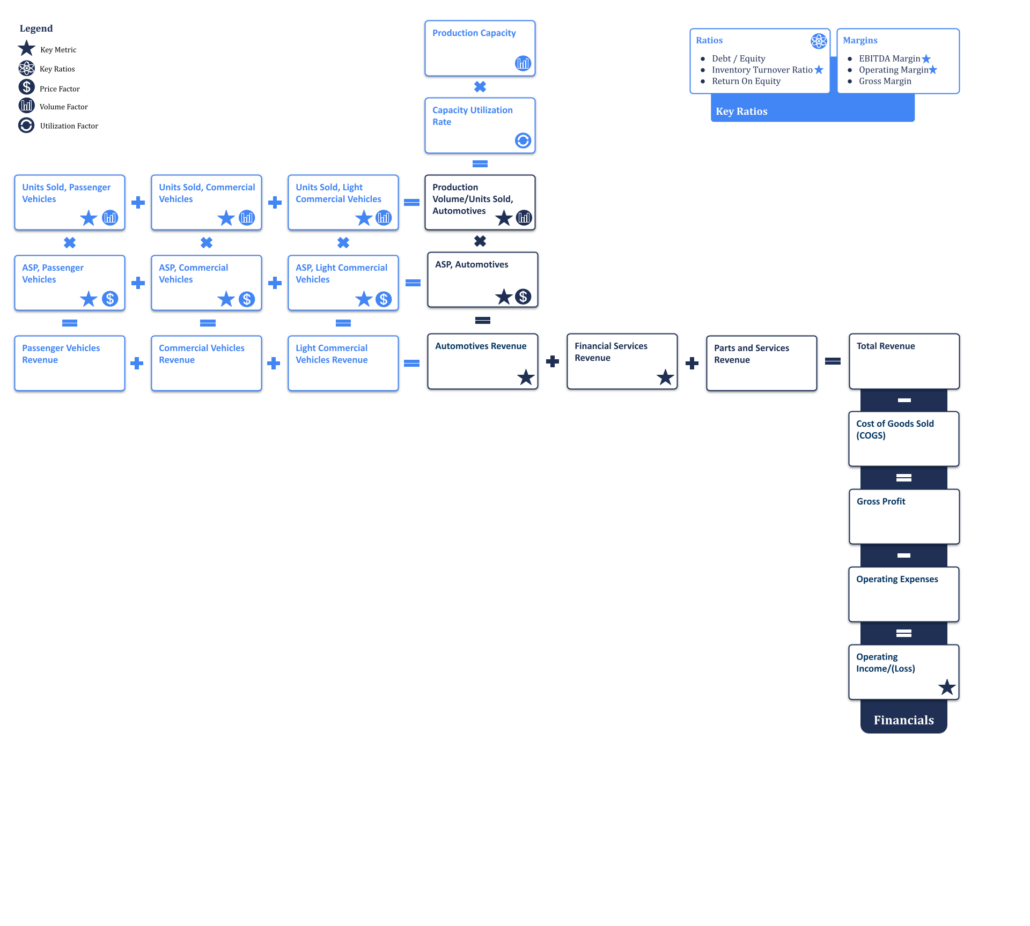
Traditionally, auto manufacturers generate the majority of their revenue and profits from selling vehicles and services that are directly related to the automotive business such as maintenance services. Some manufacturers may also generate revenue through financing or leasing options for their vehicles. Revenue generated by auto manufacturing companies can be divided into three segments, namely automotive, parts and services, and financial services. The automotive segment is the largest revenue-generating segment for companies within the industry. This segment generates revenue from the sale of three types of vehicles: passenger, light commercial, and commercial vehicles. Passenger vehicles are designed primarily for the transportation of people rather than goods. These vehicles include compact cars, sedans, SUVs, MPVs (multi-purpose vehicles), and luxury vehicles. On the other hand, commercial vehicles consist of LCVs (light commercial vehicles) such as minivans, vans, mini trucks, pickup trucks, and M&HCVs (medium and heavy commercial vehicles) such as buses and trucks, which cater to a wide range of cargo-market loads such as agriculture, cement, iron and steel, vehicle carrier, petroleum, FMCG, and other applications with options of load bodies, tankers, bulkers, and trailers.
Total revenue for companies in the industry can be simply calculated as the sum of revenue generated from the three segments mentioned above; i.e., automotive, parts and services, and financial services. The automotive segment’s revenue can be determined by multiplying the average selling price (ASP) by the number of units or vehicles sold. Alternatively, the revenue generated from passenger, light commercial, and commercial vehicles can be added together to calculate the automotive segment’s revenue. Both passenger vehicle revenue and commercial vehicle revenue are determined by multiplying ASP by the number of units sold. ASP is an important metric for auto manufacturers as it provides insight into the pricing strategy of an auto manufacturer and the demand for its products. ASP measures the average price at which vehicles are sold to customers during a given period. Units sold measures the number of vehicles sold during a given period. It is a direct measure of a company’s performance in terms of its ability to sell vehicles and generate revenue. Tracking both ASP and units sold helps auto manufacturing companies analyze their revenue trends over time and make decisions on pricing, production, and marketing to improve revenue and profitability.
Production volume or units sold can also be determined using production capacity and capacity utilization rate. Production capacity refers to the maximum number of vehicles that an auto manufacturer can produce within a specific time frame when operating at full capacity. Capacity utilization rate measures how effectively a manufacturer utilizes its production capacity to manufacture vehicles. It is calculated by dividing the current output of vehicles by the potential output within a given period. A high capacity utilization rate indicates that the auto manufacturer is operating close to its maximum production capacity, demonstrating efficient resource utilization and high productivity.
Production volume is calculated by multiplying production capacity by the capacity utilization rate. It is important to note that production volume, which represents the actual number of vehicles produced during a specific period, may not always align perfectly with the number of units sold. Although there can be a slight difference between the two, it is typically negligible.
Financial services is another important revenue segment for companies in the industry. Auto manufacturers offer financing to customers for the purchase of vehicles, either through traditional loans or lease agreements. This provides a significant source of revenue for auto manufacturers, as they earn interest and fees on the financing provided. This also allows auto manufacturers to offer special promotions and incentives to customers to boost sales. In addition to financing, the financial services segment may also offer insurance products, such as vehicle warranties, GAP (guaranteed asset protection) insurance, and liability insurance. This provides additional revenue streams and allows auto manufacturers to offer a one-stop-shop experience for their customers. The finance services segment is highly regulated and subject to various laws and regulations that auto manufacturers must comply with, depending on where they operate.
Many auto manufacturers also have a separate division or subsidiary that specializes in producing and selling auto parts and offering maintenance services for their vehicles. The income generated from the sale of these parts and services is categorized as parts and services revenue for auto manufacturers. This segment forms an important part of the revenue stream for many auto manufacturers as customers tend to go to the dealership or authorized service centers for routine maintenance and repairs. In addition, the parts and services business provides an opportunity to sell additional products and services, such as extended warranties and accessories. Auto manufacturers may produce parts for their own vehicles or supply parts to other manufacturers, as well as to independent repair shops and distributors. Some auto parts are made in-house, while others may be outsourced to third-party suppliers.
Other important metrics for auto manufacturers include days inventory outstanding (DIO) and inventory turnover ratio. These metrics provide a slightly different perspective. DIO is the average number of days it takes for a company to sell its inventory. To calculate DIO, divide the average inventory by the cost of goods sold (COGS), and then multiply the result by the number of days in a given period. A high DIO indicates that a company is holding too much inventory, which can result in higher costs associated with storage, handling, and depreciation. On the other hand, a low DIO suggests that a company is selling its inventory quickly, which can improve cash flow and reduce the risk of inventory becoming obsolete.
Inventory turnover ratio measures how many times a company sells and replaces its inventory in a given period. It focuses on the relationship between the cost of goods sold (COGS) and the average inventory value. A high turnover ratio indicates that the company is efficiently managing its inventory, as it suggests that goods are being sold rapidly.
To evaluate the profitability of companies in this industry, analysts focus on margins, including; EBITDA margin, operating margin, and gross margin.
Other ratios that are key to this industry include:
- Debt / Equity
- Return on Equity (ROE)
Available Comp Tables - Consensus Estimates
Visible Alpha offers six auto manufacturer-related comp tables, comparing forecasts for key financial and operating metrics, to make it easy to quickly conduct relative analysis, whether you are interested in looking at key values for global companies, Americas, or Europe. Every pre-built, customizable comp table is based on region, sub-industry, or key operating metrics.

Global Financial and Operating KPIs Company Examples:
North America
- FORD MOTOR CO (NYSE: F)
- General Motors Co (NYSE: GM)
- Tesla, Inc. (NASDAQ: TSLA)
- Rivian Automotive Inc (NASDAQ: RIVN)
- Lucid Group, Inc (NASDAQ: LCID)
EMEA
- Volkswagen AG (FWB: VOW3)
- Stellantis N.V (BIT: STLAM, NYSE: STLA)
- Bayerische Motoren Werke AG (FWB: BMW)
- Mercedes-Benz Group AG (FWB: MBG)
- Renault SA (EPA: RNO)
APAC
- Toyota Motor Corp (TSE: 7203, NYSE: TM)
- Hyundai Motor (KRX: 005380, OTCMKTS: HYMTF)
- Honda Motor Co., Ltd. (TSE: 7267, NYSE: HMC)
- SAIC Motor (SSE: 600104)
- Nissan Motor (TSE: 7201, OTCMKTS: NSANY)
Download Report
This guide highlights the key performance indicators for the auto manufacturing industry and where investors should look to find an investment edge, including:
- Auto Manufacturing Industry Business Model & Diagram
- Key Auto Manufacturing Metrics PLUS Visible Alpha’s Standardized Industry Metrics
- Available Comp Tables
- Industry KPI Terms & Definitions