


Guide to Asset Management Industry KPIs
This guide highlights the key performance indicators for the Asset Management industry and where investors should look to find an investment edge.
Industry Overview
The asset management industry is an integral component of the larger financial system. Asset management companies (AMCs) are responsible for the management of their client’s funds, investing pooled funds from their clients–which includes both retail and institutional investors–into a variety of securities and assets.
AMCs make investment decisions on their behalf, to meet their financial goals. This is done using an array of financial instruments such as equity, debt, and other alternative instruments. Asset management companies charge fees for these services, usually, a percentage of their client’s assets under management (AUM), and this can vary depending on the geography, asset class, investment style, and so on. For example, if a client demands more active management of their funds, this will demand higher fees as compared to a passively managed fund.
AMCs invest their clients’ funds based on pre-agreed investment mandates. They use different strategies when managing the assets of their clients and these strategies vary depending on the asset type, client, and investment style, among others.

Key Asset Management Industry Metrics
Key performance indicators (KPIs) are the most important business metrics for a particular industry. When understanding market expectations for Asset Management, whether at a company or industry level, some Asset Management KPIs to consider include:
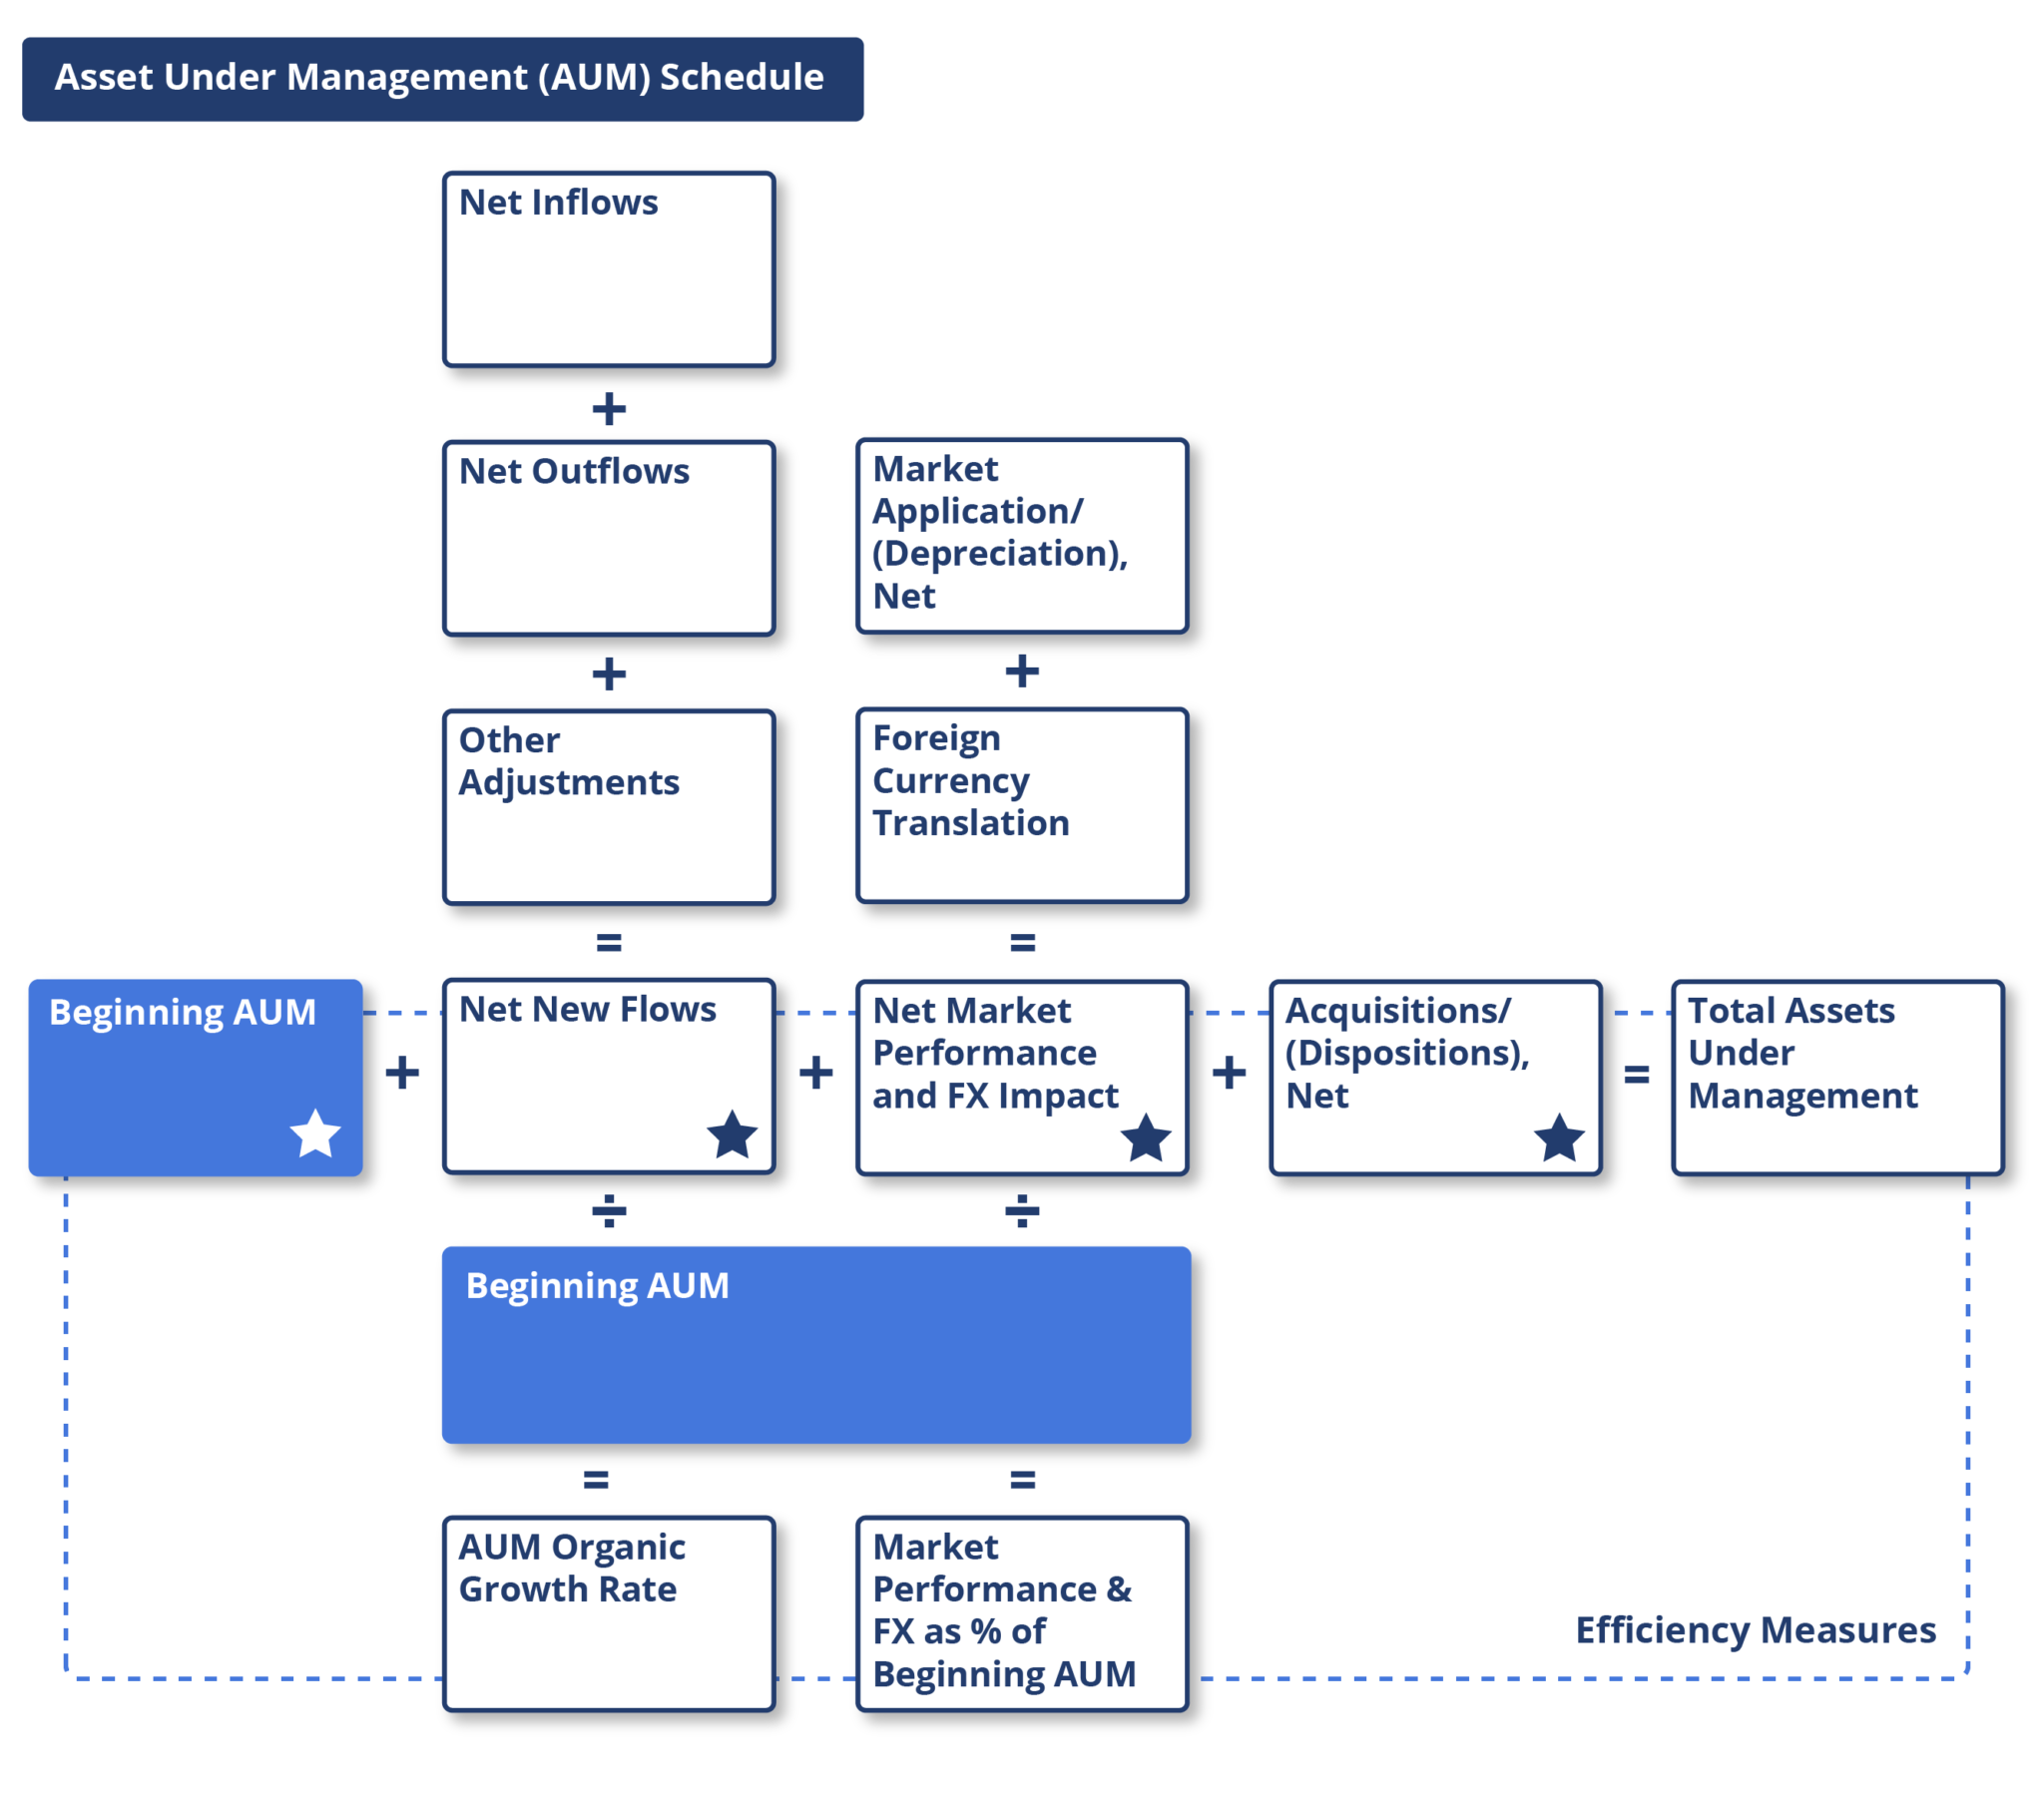
- AUM Roll-Forward
- Revenue Drivers
- Income Statement
- Key Ratios
Asset Management Business Model
-
Expenses
-
Revenue
-
Profitability and Distribution
The largest category of non-interest expenses for an asset management company are compensation expenses and employee benefits. In addition to these employee costs, asset management companies incur expenses related to professional services and fees.
When evaluating the operating efficiency of asset management companies, analysts use the ratio of non-interest expenses to total revenue. This ratio is commonly known as the efficiency ratio in the U.S. and the cost-to-income ratio in other countries. When evaluating the expenses of an asset management company, analysts look at both the level of the efficiency ratio, its trend (a downward trend is generally preferred), and how it compares to its peers.
A major source of revenue for an asset management company is fees and commissions income, mainly management fees and performance fees.
The management fee rate is an agreed-upon rate applied to the assets under management (AUM). Management fees, a major source of revenue for an asset management company, are computed by multiplying the agreed-upon fee rate with the average AUM. This fee rate can vary depending on factors such as the asset class strategy and geography. When analyzing the management fees earned by an AMC on the total assets managed, analysts look at the ratio of fees to AUM (the management fee rate ratio). Additionally, when analyzing the total revenue generated by an AMC on the total assets managed, analysts look at the revenue margin on the average AUM for companies where the revenue is generated from other sources as well.
Performance fees or incentive fee rates are fees charged by an asset management company for generating returns exceeding a predetermined benchmark on the assets managed, unlike the management fee, which is charged without any regard to the return generated.
Profitability
Analysts rely on return ratios to compare the profitability of asset management companies. The most popular return ratios or indicators are return on assets and return of equity. These ratios are measured as:
Return on average assets – Net income applicable to common shareholders as a percentage of average assets.
Return on average equity – Net income applicable to common shareholders as a percentage of average common shareholders’ equity.
Distributions
When companies are profitable, they distribute capital to shareholders by paying dividends and/or by repurchasing shares. An asset management company’s distributions are analyzed using payout ratios, which are dividends and/or repurchases relative to earnings.
Available Comp Tables - Consensus Estimates
Visible Alpha offers 3 Asset Management-related comp tables, comparing forecasts for key financial and operating metrics, to make it easy to quickly conduct relative analysis, whether you are interested in looking at key values for Blackrock Inc. or Invesco Ltd. Every pre-built, customizable comp table is based on region, sub-industry, or key operating metrics.

Global Financial and Operating KPIs Company Examples:
North America
- Blackrock Inc (BLK_US)
- GOLDMAN SACHS GROUP INC (GS_US)
- T.ROWE PRICE GROUP INC (TROW_US)
- INVESCO LTD (IVZ_US)
- FRANKLIN RESOURCES INC (BEN_US)
EMEA
- Amudi (AMUN_UK)
- Crédit agricole S.A (CASA_FR)
- DWS Group GmbH & Co KGaA (DWS_DE)
- M&G Plc (MNG_GB)
- UBS Group (UBSG_CH)
APAC
- Macquarie Group Limited (MQG_AU)
- AMP Ltd (AMP_AU)
- Magellan Financials (MFG_AU)
- Perpetual Ltd (PPT_AU)
- HDFC Asset Management Company Limited
Download Report
This guide highlights the key performance indicators for the asset management industry and where investors should look to find an investment edge, including:
- Asset Management Industry Business Model & Diagram
- Key Asset Management Metrics PLUS Visible Alpha’s Standardized Industry Metrics
- Available Comp Tables
- Industry KPI Terms & Definitions