


Guide to Application Software Industry KPIs
This guide highlights the key performance indicators for the Application Software industry and where investors should look to find an investment edge.
Industry Overview
The application software industry includes companies primarily involved in application development and deployment, system infrastructure software, digital engagement, analytics, cognitive/artificial intelligence (AI), automated data analysis, machine learning (ML), and enterprise content analytics management, among others. The industry can be categorized into highly programmable services, system services, open-source, and software as a service (SaaS).

Key Application Software Industry Metrics
Key performance indicators (KPIs) are the most important business metrics for a particular industry. When understanding market expectations for application software, whether at a company or industry level, some application software KPIs to consider include:
- Total revenue - Subscription
- Total revenue - Professional Services and Others
- Annual Recurring Revenue (ARR)
- Net Revenue Retention Rate (%)
- Remaining Performance Obligation (RPO)
- Billings
- Bookings (not universally available)
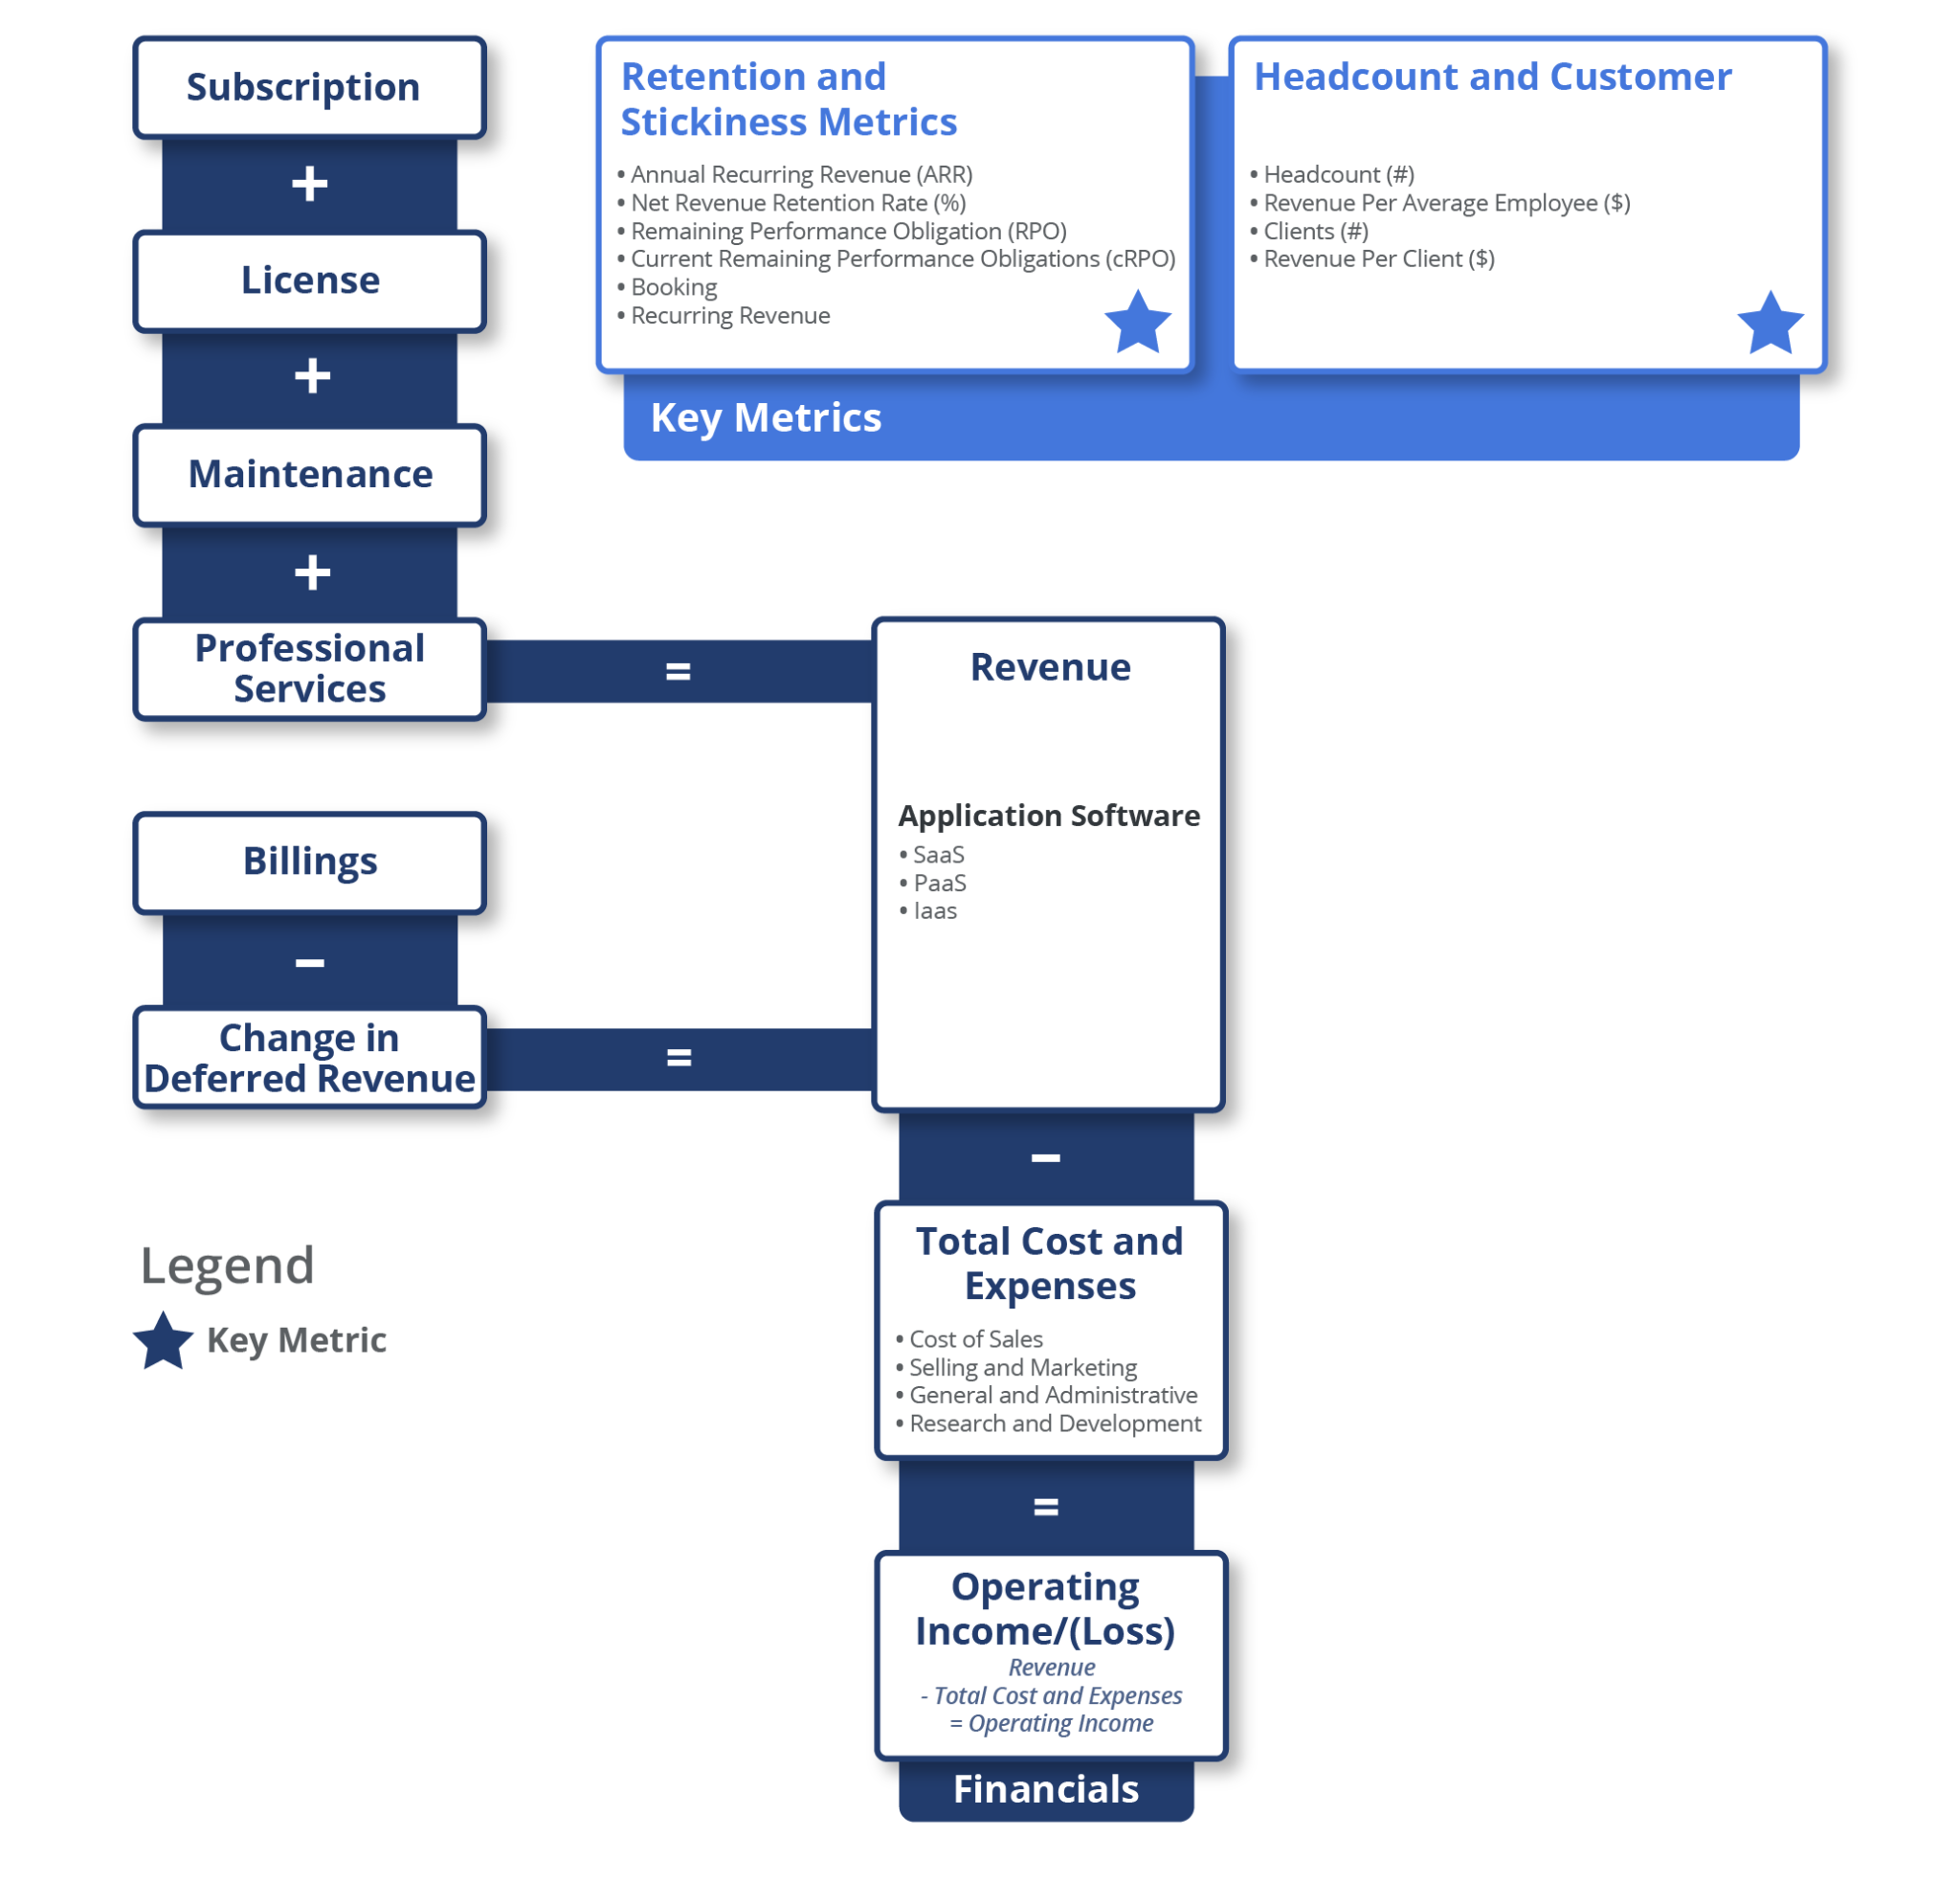
Application Software Business Model
-
Cost of Revenue Analysis
-
Revenue
-
Profitability
-
Indicators for Revenue Metrics
Total cost of revenue – Subscription includes all expenses associated with data center capacity costs, depreciation and amortization costs related to infrastructure hardware equipment and intangible assets, and employee-related costs such as salaries, benefits, and stock-based compensations.
Total cost of revenue – License includes expenses associated with third-party royalties, distribution costs, acquired rights to use technology, excess and obsolete inventory, localization costs, and the costs associated with the manufacturing of products.
Total cost of revenue – Professional services and other includes employee-related costs directly associated with consulting and training departments, subcontractor expenses, travel expenses, and allocated overhead for facilities.
Revenue Analysis
Application software companies generate revenue mainly from four segments; subscription, license, maintenance, and professional services. Total revenue is calculated as the sum of these four individual segments.
Subscription Revenue
Subscription revenue is the revenue generated from the sale of subscription software licenses, support subscriptions, software entitlement, and cloud-based SaaS offerings. It consists primarily of fees earned from subscription-based arrangements giving customers the right to use the software. Subscription revenue is mainly driven by the number and size of active licenses, the type of product, and the price of subscriptions.
License Revenue
License revenue is the revenue generated from fees that customers pay to use core product solutions such as databases, middleware, and application software in an on-premise IT environment. License revenue can be broadly categorized into perpetual licenses and term licenses. Perpetual licenses generate a one-time fee through lifetime subscriptions. On the other hand, term licenses are for a specific period.
Maintenance Revenue
Maintenance revenue includes fees generated from providing customers with unspecified future updates, upgrades, enhancements, and technical product support for perpetual license products, on an if and when available basis.
Maintenance revenue is the revenue generated from renewal fees from existing maintenance plan agreements, purchased with a perpetual software license. It includes any kind of support contract (PCS- Post Contract Customer Support) which generally includes rights to unspecified upgrades, telephone and internet-based support, updates, and bug fixes.
A company’s maintenance products, including software license updates and product support fees, are generally priced as a percentage of its new software license fees.
Professional Services Revenue
Professional services revenue is revenue generated from fees charged for implementation services, on-site support, cloud configuration, and other consulting, training, and educational services. Also included in professional services revenue is revenue related to training and customer-reimbursed expenses, as well as services related to software licenses for on-premise solutions.
Professional services, offered with software licenses, consist mainly of technical and training services. Technical services include installation, customization, implementation, and consulting services related to a company’s product. Training services include product training via access to online modules or delivering a training package customized to the client’s needs.
Analysts covering the application software industry assess company performance by focusing on sales growth, gross profit margins, and operating profit margins. For valuation, the key multiples they use include enterprise value to sales (EV/Sales) and enterprise value to free cash flow (EV/FCF). For more mature companies in later stages of growth, they will also look closely at enterprise value-to-EBITDA (EV/EBITDA), EBITDA margins, and price/earnings ratios (P/E).
In recent years, we’ve seen analysts start to track a ratio called the Rule of 40, especially for SaaS companies. This ratio is calculated by adding sales growth (%) and profit margin (%) or FCF margin (%) together. Values above 40% are considered good. The rule of 40 is a useful measure of performance since it helps normalize the measurement of performance between companies, given the trade-offs they make between growth and profitability at different stages of their growth cycle.
Recurring revenue comprises fees generated from the use of subscription-based solutions, license revenue from the sale of perpetual license products, and maintenance services for on-premises solutions. Recurring revenue is calculated as subscription revenue + maintenance revenue.
Annual recurring revenue (ARR) is a yearly value of predictable and recurring revenue generated from subscriptions or maintenance contracts, expressed on a last twelve-month basis. It excludes non-recurring revenue streams such as certain professional services. ARR is an important revenue measure for software companies since it helps illustrate both the level of repeat business as well as the positive or negative momentum from new sales or lost business. ARR is typically calculated by dividing the total contract value by the number of months in the term for both contracts with terms of less than a year and multi-year contracts to derive a monthly value that is then annualized by multiplying it by twelve.
Net revenue retention rate (NRR) (%) is a metric that provides insight into a company’s ability to retain and expand revenue generated from its existing customer base (e.g. take-up of additional products or user additions at an existing client), offset by the customers who do not renew contracts. This metric is an indicator of the long-term value and strength of customer relationships.
An increase in NRR is indicative of an improvement in sales execution or changing market demand dynamics while a decline acts as an early indicator of easing revenue growth. The computation of NRR is not consistent among companies. Some of the approaches used include:
- Revenue* from base customers in the current quarter (TFQ**)
Revenue from base customers in the quarter a year ago (TFQ**)
*includes expansion net of contraction/attrition; excludes new customers.
** TFQ – Trailing four quarter average. - ARR* from base customers in the current quarter (TFQ**)
ARR from base customers in the quarter a year ago (TFQ**)
*ARR attributable to customers (base customers) as of the end of the same quarter of the prior fiscal year.
** TFQ – Trailing four quarter average - Weighted average of TTM (Current period ARR**/Prior period ARR*)
*ARR from the cohort of all customers as of 12 months before the current period-end.
**ARR from the same customers as of the current period-end. Current period ARR includes expansion/contraction/attrition over TTM; excludes ARR from new customers. - Current period ACV* ∕ Prior period ACV
*includes existing customer expansion and net of churn over the last 12 months but excludes ARR from new customers in the current period as well as any ARR associated with paid trials.
The remaining performance obligation (RPO) is the amount of contracted revenue yet to be recognized. RPO is an important metric as it provides insights into a company’s future obligations, revenue visibility, customer commitments, and long-term deals. RPO includes deferred revenue and non-cancelable, non-invoiced amounts. It excludes performance obligations subject to cancellation terms and billed in arrears.
Available Comp Tables - Consensus Estimates
Visible Alpha offers 13 application software-related comp tables, comparing forecasts for key financial and operating metrics, to make it easy to quickly conduct relative analysis, whether you are interested in looking at key values for application software companies globally, in the Americas, or Europe. Every pre-built, customizable comp table is based on region, sub-industry, or key operating metrics.

Global Financial and Operating KPIs Company Examples:
North America
- Bill.com Holdings Inc (BILL_US)
- SALESFORCE COM INC (CRM)
- Oracle Corporation (ORCL)
- RINGCENTRAL INC (RNG_US)
- Adobe Systems Incorporated (ADBE)
EMEA
- Atlassian Corporation PLC (TEAM_US)
- Procore Technologies Inc (PCOR_US)
- SAP SE (SAP_US)
- Dassault Systèmes (DSY_FR)
APAC
- Xero Ltd (XRO_AU)
- Yonyou Network Technology (600588_CN)
- Kingdee International Software Group Co. Ltd. (0268_HK)
- Megaport Ltd (MP1_AU)
Download Report
This guide highlights the key performance indicators for the application software industry and where investors should look to find an investment edge, including:
- Application Software Business Model & Diagram
- Key Application Software Metrics PLUS Visible Alpha’s Standardized Industry Metrics
- Available Comp Tables
- Industry KPI Terms & Definitions