


Research — JUNE 27, 2025
Who are America's sports bettors?

By Keith Nissen
A profile of sports bettors shows that they span all age and income groups. They watch sports at above average levels and are most likely to engage online with sports leagues, teams and players.

➤ Only 15% of surveyed US internet adults report using a sportsbook to place online sports bets.
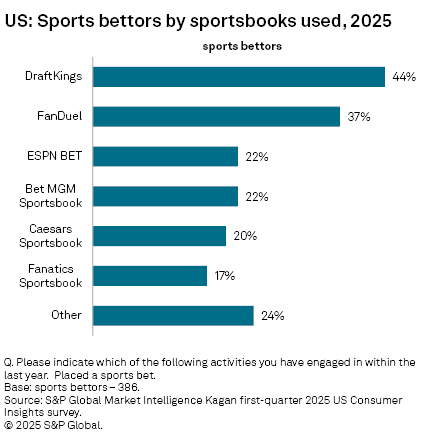
➤ FanDuel and DraftKings were the most popular online sportsbooks used by survey respondents. Sportsbook bettors use approximately two sportsbooks, on average.
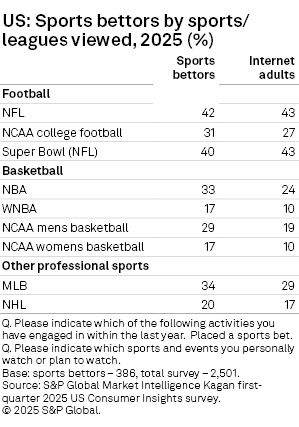
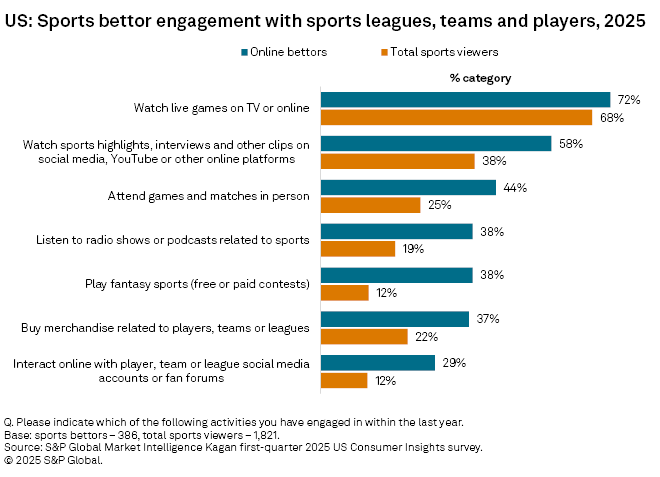
➤ Football is the most popular sport for sports bettors, with nearly all viewing NFL football games. Sports bettors are much more likely than typical sports fans to view sports highlights, attend games in person, buy merchandise, play fantasy sports and interact via social media with leagues and teams.
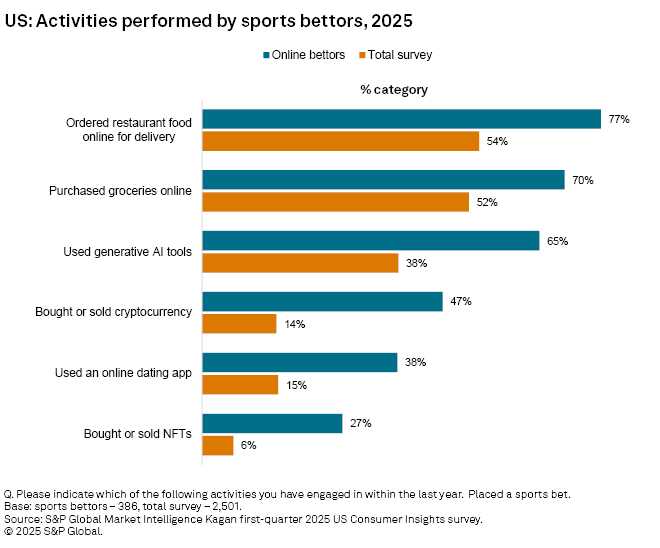
➤ Sports bettors are also more likely to perform other online activities, including buying food and groceries online, buying and selling cryptocurrency, as well as using online platforms, such as generative AI and online dating apps.

The S&P Global Market Intelligence Kagan US first-quarter 2025 Consumer Insights survey found that 15% of internet adults placed an online sports bet over the past year, essentially flat year over year. DraftKings was the most popular sportsbook with 44% of online sports bettors reporting its use. Over one-third (37%) of sports bettors said they use FanDuel, followed by ESPN BET and BetMGM, both with 22% of US sports bettors. Overall, the survey found that individuals placing sports bets used 1.9 sportsbook apps, on average.
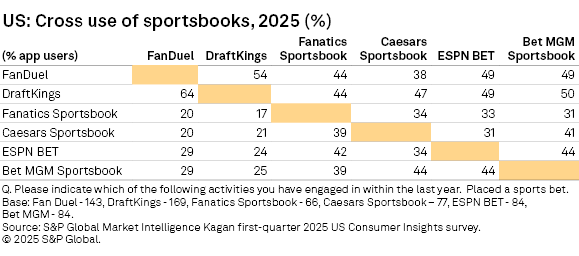
The following table illustrates the cross-use of major sportsbooks. The survey data shows that approximately two-thirds (64%) of FanDuel users also use DraftKings and the majority (54%) of DraftKings users use FanDuel. Approximately half of ESPN BET and Bet MGM users indicated they use one of the top two market leading sportsbooks, as well.
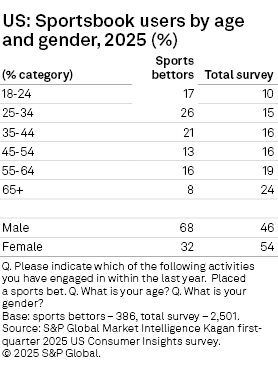
The survey data shows that those betting on sports span all age groups, though they over-index toward younger adults. Four out of 10 (43%) sports bettors were individuals under 35 years of age compared to 25% for the total survey. In contrast, only 24% of sports bettors were 55 years of age and older, whereas this age group represented 43% of the overall survey. Over two-thirds (68%) were men compared to 46% for the total survey.
The highest percentage of sports bettors (40%) had a household income between $50,000 and $100,000 per year, slightly above the overall survey (37%). Those with an annual household income of $150,000 or more represented only 10% of the survey, but 17% of total sports bettors. One-quarter (27%) of sports bettors came from low-income households (less than $50,000), compared to 37% for the entire survey.
The survey found that sports bettors spend approximately one-third (30%) of their daily TV/video viewing hours watching sports, compared to only 12% for those that do not bet on sports. However, 10% of sports bettors said they do not watch TV sports at all.
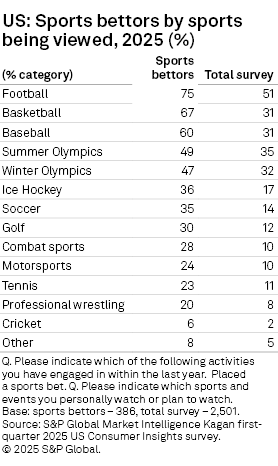
In addition to spending above average hours watching sports, the survey data shows that sports bettors are more likely to watch a wide variety of sports than the overall internet adult population. For example, three-quarters (75%) of sports bettors said they watch football, compared to 51% of total surveyed internet adults. Viewing of basketball (67%), and baseball (60%) among sports bettors is double that of overall consumers. The same can be said for ice hockey, soccer and most other sports.
But the viewing habits of sports bettors are more closely aligned with sports fans, in total. For instance, the survey found that 42% of sports bettors watch NFL football games, while 43% of those watching football (in total) watch NFL games. The largest variance is with NCAA football, with 29% of sports bettors watching college football compared to 19% of football fans, overall.
Sports bettors also tend to be more engaged with sports leagues, teams or players than sports fans, in general. The survey found that sports bettors were significantly more likely to watch sports highlights and other clips (58%) than overall US sports fans (38%). Likewise, the data shows that the percentage of sports bettors that attend games in person, play fantasy sports, buy sports merchandise, or interact on sports-related social media accounts was substantially higher than with fans that do not place sports bets.
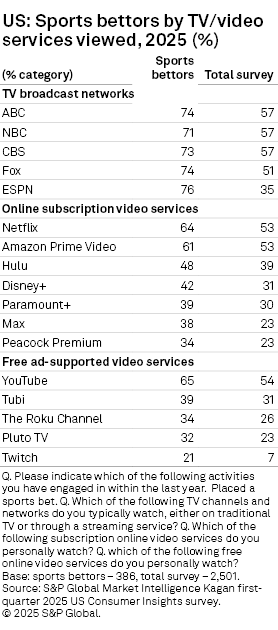
Examining the TV/video networks and services used by sports bettors reveals that they are more likely to watch broadcast TV networks that televise live sports than the overall public. Approximately three-quarters of sports bettors reported watching the main four broadcast networks (ABC, NBC, CBS and Fox), as well as ESPN, substantially higher than US internet adults, overall.
Sports bettors were also much more likely to subscribe to both online subscription video services, such as Netflix and Amazon Prime Video than consumers, in general. The survey found that the use of Netflix among sports bettors was 11 percentage points higher than the overall survey, while the use of Amazon Prime Video by sports bettors exceeded national totals by eight percentage points. Sports bettors use five SVOD services, on average compared to three SVOD subscriptions for internet adults, overall.
Similarly, sports bettors were more likely to watch free, ad-supported online video services than the overall public. For example, two-thirds (65%) of sports bettors said they watch YouTube, 11 percentage points higher than national totals. The survey found that sports bettors use an average of three (2.9) free online video services, compared to 1.9 services used nationally.
Finally, we compared other non-sports-related activities performed by sports bettors to the overall survey. The survey results show that sports bettors are more likely than their non-wagering counterparts to buy/sell cryptocurrency and NFTs, use an online dating app and even order restaurant food/groceries online.
This article was published by S&P Global Market Intelligence and not by S&P Global Ratings, which is a separately managed division of S&P Global.
Consumer Insights is a regular feature from S&P Global Market Intelligence Kagan.
The Kagan first-quarter 2025 US Consumer Insights survey was conducted in March 2025. The survey consisted of 2,501 internet adults with a margin of error of +/-1.9 ppts at the 95% confidence level. Survey data should only be used to identify general market characteristics and directional trends.