


Research — JULY 18, 2025
State of US NHL fans, 2025

By Keith Nissen
Only 17% of Americans view NHL hockey, but the fan base closely matches the age distribution of the overall US population. The majority of NHL fans in the US are moderately or highly engaged sports fans.

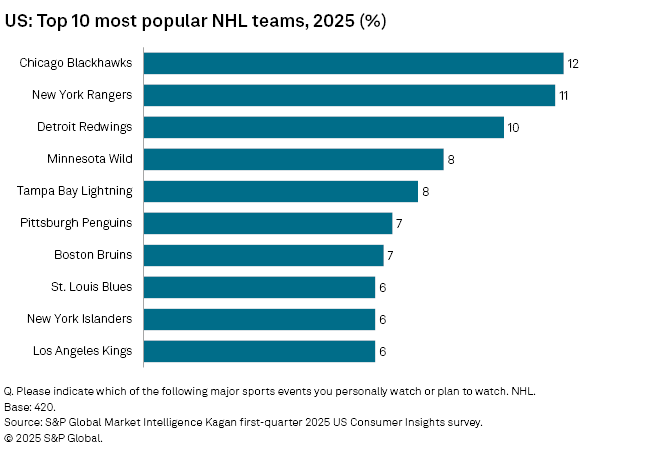
➤ Recent survey results showed that the Chicago Blackhawks and New York Rangers were the two most popular NHL teams in the US market.
➤ Nearly half of NHL fans are adults aged 55 and older, skewed heavily toward men.
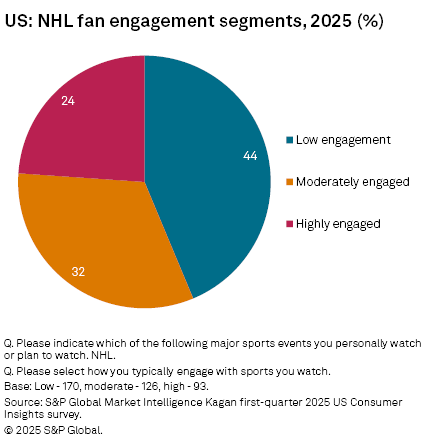
➤ Fifty-six percent of NHL fans were moderately or highly engaged sports fans, performing activities such as buying merchandise, viewing highlights, and placing sports bets, beyond watching games.
➤ NHL fans subscribe to more SVOD services and are more likely to access major TV networks than the overall US internet adult population.

Results from historic S&P Global Market Intelligence Kagan US Consumer Insights surveys show that viewership of NHL hockey has remained essentially flat at 17% of total US internet adults over the past three years. The Kagan US first-quarter 2025 Consumer Insights survey found that the top three most popular hockey teams were the Chicago Blackhawks, New York Rangers and the Detroit Redwings. Approximately three-quarters of Americans watching NHL games reside in a state that is home to an NHL team.
Data from the 2025 survey shows that NHL hockey fans were generally reflective of the overall US internet adult population. However, 45% of NHL fans were aged 55 or older, compared to only 20% for young adults, ages 18–34. NHL viewership is heavily skewed toward men (63%) and those with a college education (65%). Annual household income generally mirrored that of the total survey.

NHL fans spend over five hours per day (5.6) watching TV/video, on average. This is nearly identical to the overall internet adult population. However, NHL viewers indicated they spend 25% of their average daily viewing hours watching sports, compared to only 15% among total survey respondents.
To assess sports engagement, survey respondents were asked if they perform activities that include watching games on TV and attending games in person. Other activities included buying sports merchandise, watching sports highlights, listening to sports podcasts or radio shows, betting on sports, participating in fantasy sports and interacting on social media with team or league accounts. The responses were aggregated, and three segments were created. Those with low engagement, representing 44% of NHL fans typically perform one or two sports engagement activities, while those that are moderately engaged (32%) said they perform three or four activities. Highly engaged sports fans (24%) reported performing at least five of the eight sports engagement activities. Note: the sports engagement segments reflect individuals engaged with any of the major professional sports, not just the NHL.
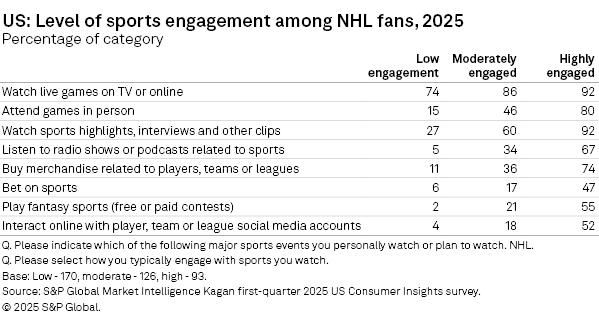
The survey found that the vast majority of NHL fans watch games on TV (broadcast or online), however, relatively few fans with low engagement attend games in person, compared to 80% of highly engaged hockey fans. The data reflects that the 44% of NHL fans with low sports engagement were much less likely to watch sports clips and highlights, listen to sports-related podcasts, interact on social media, buy merchandise, place sports bets or participate in fantasy sports than even those who are moderately engaged.
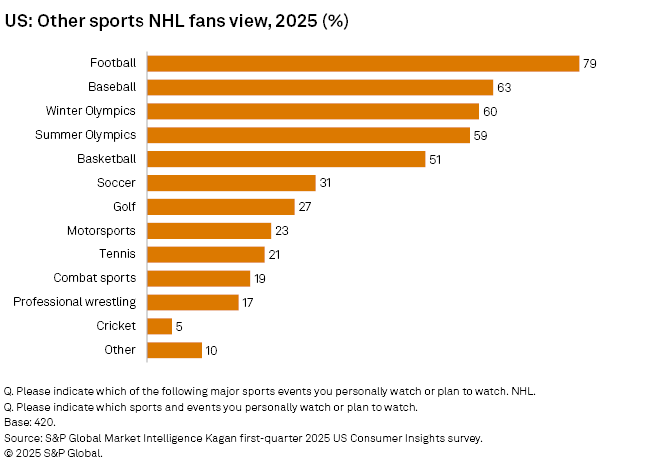
NHL fans also tend to be fans of other sports. For instance, eight out of 10 (79%) of NHL fans said they also watch professional or college football (73% watch NFL games), and nearly two-thirds (63%) watch baseball. The Winter Olympics is slightly more popular among NHL fans than the Summer Olympics, possibly because of their interest in hockey and other winter sports, such as curling and skiing. The majority (51%) watch professional or college basketball, but only 40% were NBA viewers.
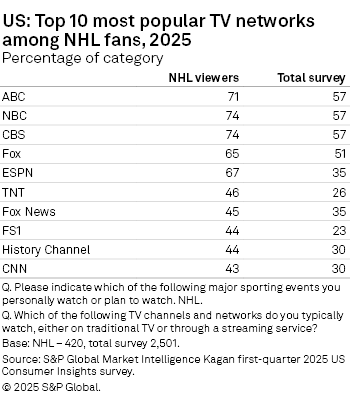
The table below shows that over two-thirds of NHL fans view the four major TV networks (ABC, NBC, CBS and Fox). TV networks that carry live sports, such as ESPN, TNT and Fox’s FS1 were also very popular. Rounding out the top 10 TV networks were Fox News (45%), the History Channel (43%) and CNN (43%). All of these TV networks had substantially higher viewership among NHL fans than among total survey respondents.
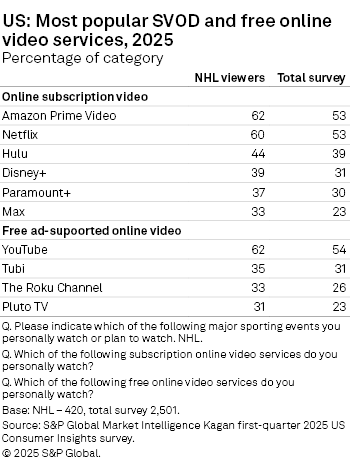
NHL fans subscribe to four (4.4) online video subscription services, on average, which is higher than the 3.3 SVOD services used by Americans, in total. Amazon Prime and Netflix were by far the most popular SVOD services. NHL fans use slightly more free online video services (2.4) on average than the overall internet population (1.8 services). Six out of 10 NHL fans watch video content on YouTube. Tubi, the Roku Channel and Pluto TV were used by approximately one-third of NHL fans.
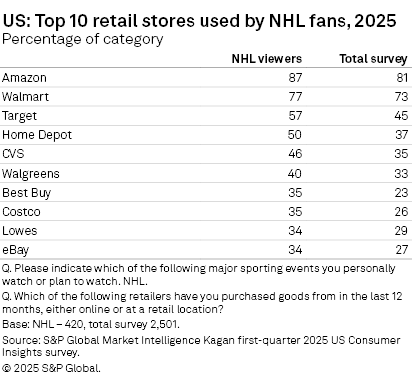
The survey results reflect the popularity of Amazon for retail purchases among both NHL fans, as well as Americans, in general. Walmart is not far behind. The data shows that NHL fans tend to shop at retailers such as Target, the Home Depot, CVS, and Best Buy more so than total survey respondents.
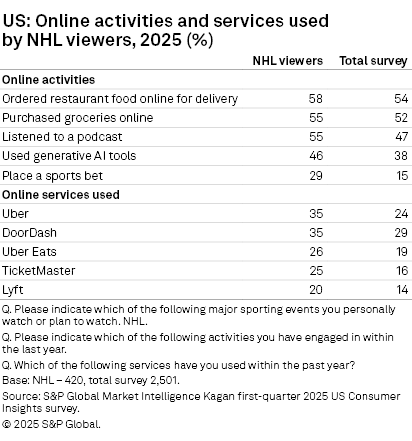
Finally, the following table highlights that NHL fans closely mirror that of the overall population in terms of activities, such as ordering food/groceries online for delivery. NHL fans are only slightly more likely to listen to podcasts (in general) and use generative AI tools but are much more likely to place a sports bet. The data shows that NHL fans were also more likely than total survey respondents to use online services for transportation (e.g. Uber/Lyft), food delivery (e.g. Uber Eats, DoorDash), and event tickets (TicketMaster/StubHub).
This article was published by S&P Global Market Intelligence and not by S&P Global Ratings, which is a separately managed division of S&P Global.
Consumer Insights is a regular feature from S&P Global Market Intelligence Kagan.
The Kagan first-quarter 2025 US Consumer Insights survey was conducted in March 2025. The survey consisted of 2,501 internet adults with a margin of error of +/-1.9 ppts at the 95% confidence level. Survey data should only be used to identify general market characteristics and directional trends.