Featured Topics
Featured Products
Events
S&P Global Offerings
Featured Topics
Featured Products
Events
S&P Global Offerings
Featured Topics
Featured Products
Events
S&P Global Offerings
Featured Topics
Featured Products
Events
Financial and Market intelligence
Fundamental & Alternative Datasets
Government & Defense
Banking & Capital Markets
Economy & Finance
Energy Transition & Sustainability
Technology & Innovation
Podcasts & Newsletters
Financial and Market intelligence
Fundamental & Alternative Datasets
Government & Defense
Banking & Capital Markets
Economy & Finance
Energy Transition & Sustainability
Technology & Innovation
Podcasts & Newsletters
Research — 4 Oct, 2022

By Keith Nissen
Introduction
A comparison of results from Kagan Consumer Insights surveys conducted in Asia and the U.S. shows that internet adults in India, South Korea and China spend more time watching live TV sports, on average, than their American counterparts.

* Half of surveyed internet adults in China, India and the U.S. report watching live TV sports.
* In India, young adults are the most avid TV sports viewers, while in the U.S. it is older adults. TV sports viewing in China and South Korea are equally distributed across age groups.
* TV sports viewing tends to be universally skewed toward men, though the type of sports being watched is unique to each market.

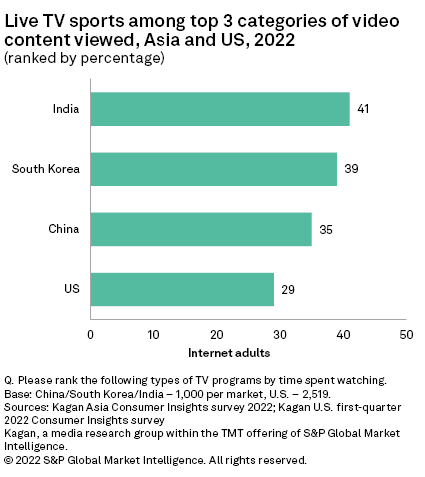
The recently completed Kagan 2022 Asia Consumer Insights survey, and the Kagan first-quarter 2022 U.S. Consumer Insights survey asked respondents to rank the types of TV content by time spent watching. The possible selections included current and older broadcast/cable network TV series, current and older online TV series, as well as live sports and news programs. The surveys found that 41% of internet adults in India ranked live sports among the top three content types they view the most. In South Korea and China, the percentage ranking live sports in the top three slots were 39% and 35%, respectively.
In the U.S., only 29% of survey respondents ranked live sports among the top three types of TV programming they view the most. This finding aligns with the 35% of U.S. internet adults who watch live sports at least once a week. But it does not necessarily suggest that Americans are less interested in watching live sports than Asian TV viewers. Factors such as time spent watching TV/video per day, how live TV sports are received and the type of sports being viewed vary greatly between the four markets.
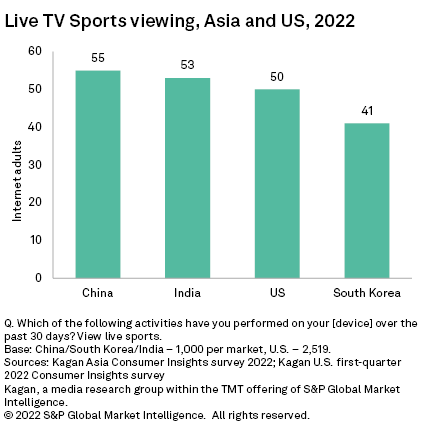
Overall, the surveys found that approximately half of internet adults in China (55%), India (53%) and the U.S. (50%) have watched live TV sports over the past month. Live TV sports viewing in South Korea is a bit lower (41%) than in the other three markets.
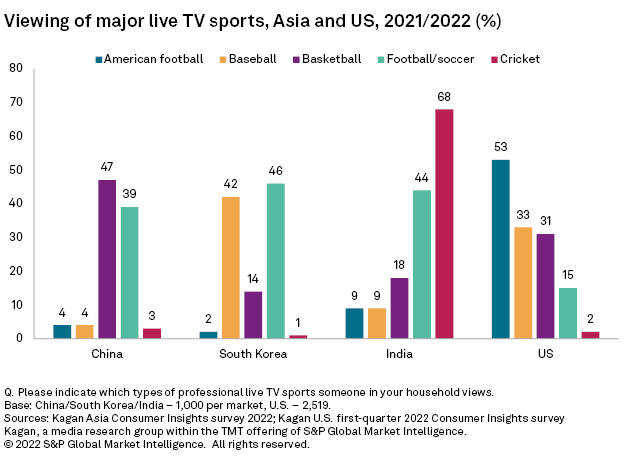
Football/soccer is one of the few live TV sports that has strong viewership across China (39%), South Korea (46%) and India (44%), but has minimal TV viewership (15%) in the U.S. Nearly half (47%) of internet adults in China report watching live televised basketball games on TV, compared to 31% in the U.S. Table tennis and badminton are also very popular in China. South Korea and the U.S. have a shared interest in watching baseball games, while cricket is dominant in India. American football is uniquely popular in the U.S.
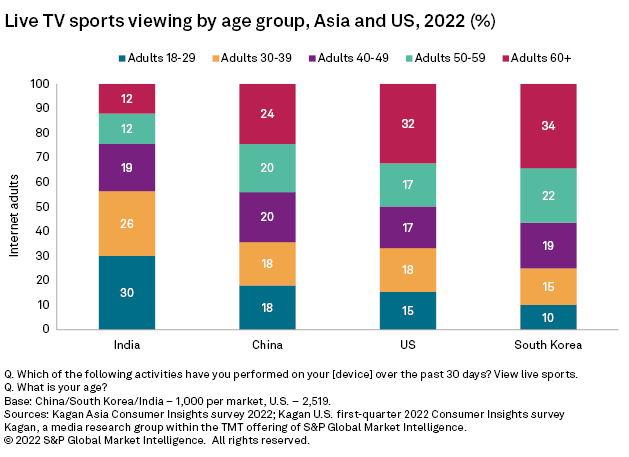
China's live TV sports viewers tend to be equally distributed across all age groups. The majority (56%) of live TV sports viewers in India are adults under 40 years of age. The opposite is true in South Korea and the U.S. where approximately half of live TV sports viewers are adults ages 50 and over. Koreans under 40 years old represent only 25% of live TV sports viewers, the lowest among the four surveyed markets.
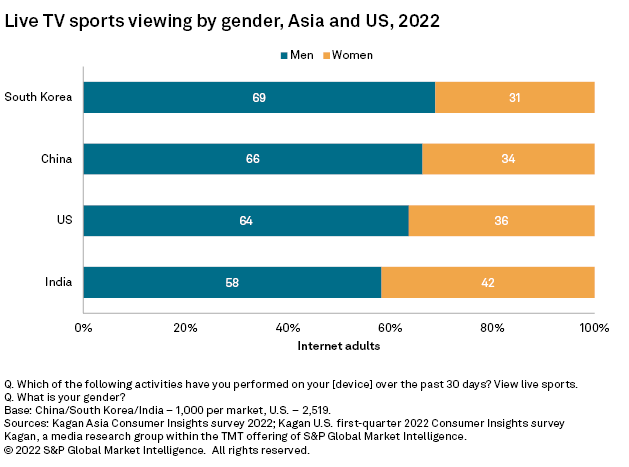
Unsurprisingly, live TV sports viewers across all four markets tend to skew toward men. In South Korea, approximately seven in 10 live sports viewers are men. China, India and the U.S. have only slightly lower male viewing than South Korea.
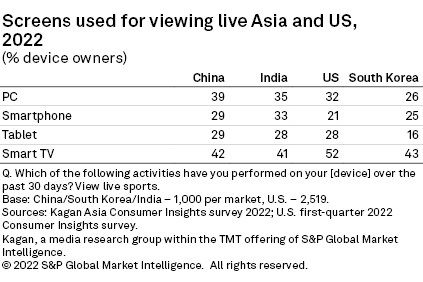
Finally, the surveys found that the television is the screen of choice for watching live TV sports in all four markets. Over half (52%) of smart TV owners in the U.S. reported using the device to watch live TV sports over the past month, compared to approximately 40% in China, India and South Korea. Streaming live sports to a smartphone is most popular in India (33%), substantially higher than in the U.S.
The 2022 Kagan Asia Consumer Insights survey was conducted during June 2022 consisting of 1,000 adults in China, South Korea and India. The survey has a margin of error of +/-3 ppts at the 95% confidence level. The Kagan first-quarter 2022 U.S. Consumer Insights survey was conducted during March 2022 consisting of 2,519 adults. The survey has a margin of error of +/-1.9 ppts at the 95% confidence level. Percentages are rounded to the nearest whole number.
Consumer Insights is a regular feature from Kagan, a group within S&P Global Market Intelligence's TMT offering, providing exclusive research and commentary.
This article was published by S&P Global Market Intelligence and not by S&P Global Ratings, which is a separately managed division of S&P Global.